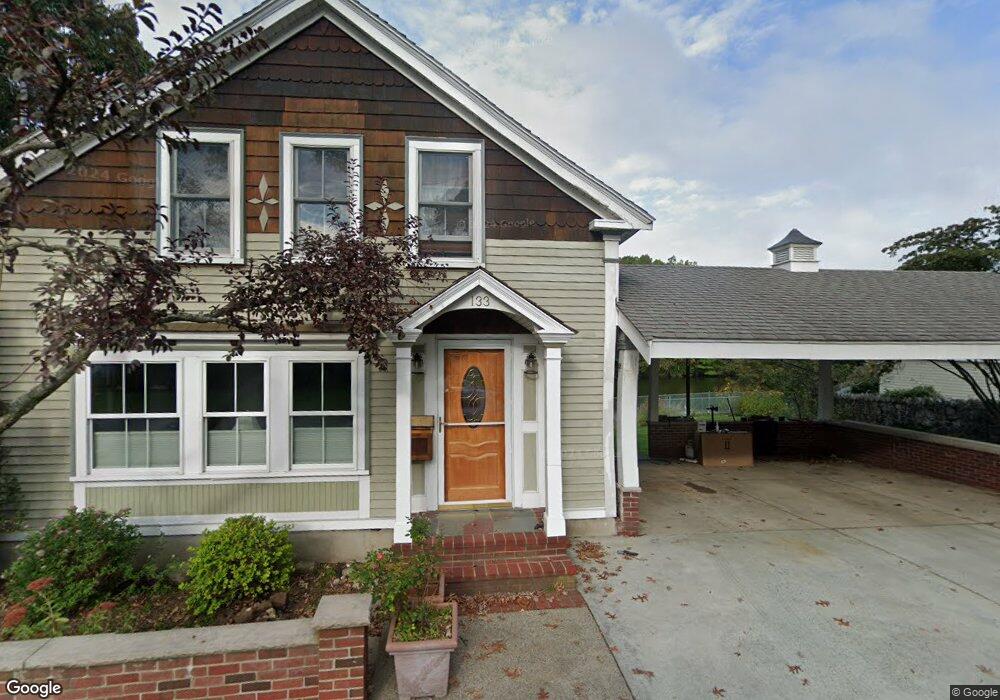
133 Foster Rd Swampscott, MA 01907
Estimated Value: $613,000 - $710,000
3
Beds
1
Bath
1,686
Sq Ft
$399/Sq Ft
Est. Value
About This Home
This home is located at 133 Foster Rd, Swampscott, MA 01907 and is currently estimated at $673,555, approximately $399 per square foot. 133 Foster Rd is a home located in Essex County with nearby schools including Swampscott Middle School, Swampscott High School, and St. Pius V. School.
Ownership History
Date
Name
Owned For
Owner Type
Purchase Details
Closed on
Nov 27, 2013
Sold by
Green E Lloyd
Bought by
Emery L Green Ret and Green
Current Estimated Value
Purchase Details
Closed on
May 3, 1999
Sold by
Roma Micheline
Bought by
Green Lloyd E and Green Eileen M
Home Financials for this Owner
Home Financials are based on the most recent Mortgage that was taken out on this home.
Original Mortgage
$171,900
Interest Rate
6.95%
Mortgage Type
Purchase Money Mortgage
Create a Home Valuation Report for This Property
The Home Valuation Report is an in-depth analysis detailing your home's value as well as a comparison with similar homes in the area
Home Values in the Area
Average Home Value in this Area
Purchase History
| Date | Buyer | Sale Price | Title Company |
|---|---|---|---|
| Emery L Green Ret | -- | -- | |
| Emery L Green Ret | -- | -- | |
| Green Lloyd E | $191,000 | -- | |
| Green Lloyd E | $191,000 | -- |
Source: Public Records
Mortgage History
| Date | Status | Borrower | Loan Amount |
|---|---|---|---|
| Previous Owner | Green Lloyd E | $171,900 |
Source: Public Records
Tax History Compared to Growth
Tax History
| Year | Tax Paid | Tax Assessment Tax Assessment Total Assessment is a certain percentage of the fair market value that is determined by local assessors to be the total taxable value of land and additions on the property. | Land | Improvement |
|---|---|---|---|---|
| 2025 | $6,624 | $577,500 | $241,800 | $335,700 |
| 2024 | $6,491 | $564,900 | $230,300 | $334,600 |
| 2023 | $6,360 | $541,700 | $230,300 | $311,400 |
| 2022 | $5,994 | $467,200 | $196,200 | $271,000 |
| 2021 | $5,774 | $418,400 | $153,500 | $264,900 |
| 2020 | $5,924 | $414,300 | $153,500 | $260,800 |
| 2019 | $6,039 | $397,300 | $136,500 | $260,800 |
| 2018 | $5,757 | $359,800 | $119,400 | $240,400 |
| 2017 | $5,772 | $330,800 | $110,900 | $219,900 |
| 2016 | $5,585 | $322,300 | $102,400 | $219,900 |
| 2015 | $5,527 | $322,300 | $102,400 | $219,900 |
| 2014 | $5,225 | $279,400 | $85,300 | $194,100 |
Source: Public Records
Map
Nearby Homes
- 150 Windsor Ave
- 9 Sampson Ave
- 100 Burpee Rd
- 44 Valley Rd
- 25 E Park Ave
- 44 Cherry St Unit 2
- 76 Stetson Ave
- 31 Madison St
- 29-31 Essex Ave Unit 2
- 59 Essex St Unit 59B
- 51 Barnstable St
- 91 Oakwood Ave
- 106 Norfolk Ave
- 80 Norfolk Ave Unit 1
- 2 Gracie Ln Unit 4
- 6 Washburn St
- 189 Burrill St Unit 2
- 5 Summit View Dr
- 10-12 Fairview Ave
- 8 Ryan Place