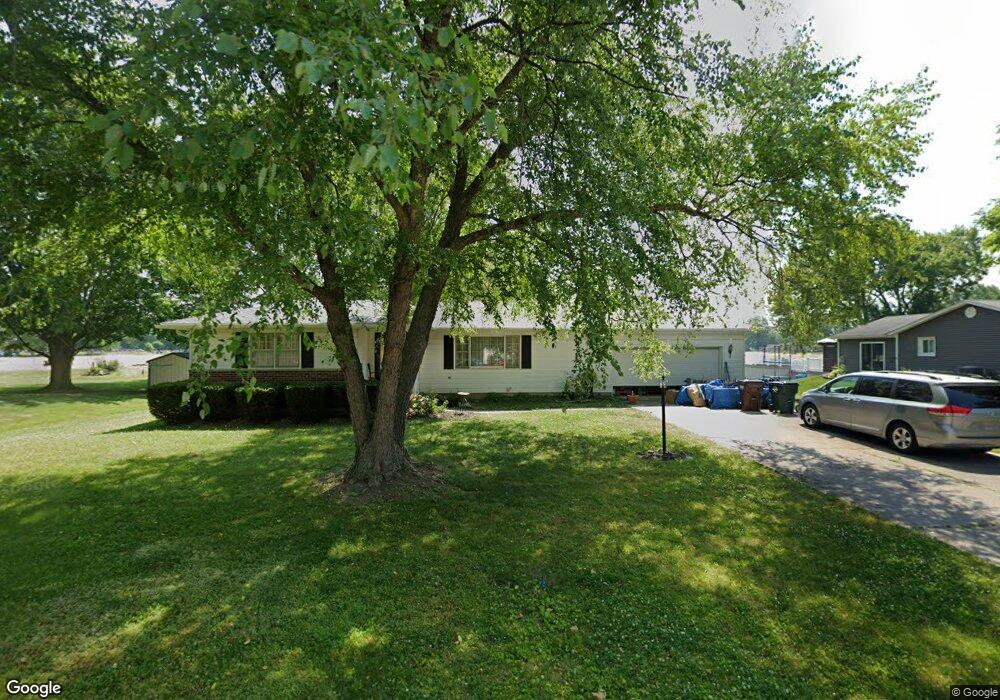
133 Gibson Ct Tiffin, OH 44883
Estimated Value: $195,514 - $266,000
3
Beds
2
Baths
1,500
Sq Ft
$157/Sq Ft
Est. Value
About This Home
This home is located at 133 Gibson Ct, Tiffin, OH 44883 and is currently estimated at $234,879, approximately $156 per square foot. 133 Gibson Ct is a home located in Seneca County with nearby schools including Columbian High School, Bridges Community Academy, and Calvert High School.
Ownership History
Date
Name
Owned For
Owner Type
Purchase Details
Closed on
Nov 7, 2019
Sold by
Bean Dorothy M and Bean Debra E
Bought by
Bean Debra E
Current Estimated Value
Purchase Details
Closed on
Sep 10, 1998
Sold by
Bean Calvin E
Bought by
Bean Dorothy
Create a Home Valuation Report for This Property
The Home Valuation Report is an in-depth analysis detailing your home's value as well as a comparison with similar homes in the area
Home Values in the Area
Average Home Value in this Area
Purchase History
| Date | Buyer | Sale Price | Title Company |
|---|---|---|---|
| Bean Debra E | -- | None Available | |
| Bean Dorothy | -- | -- |
Source: Public Records
Tax History Compared to Growth
Tax History
| Year | Tax Paid | Tax Assessment Tax Assessment Total Assessment is a certain percentage of the fair market value that is determined by local assessors to be the total taxable value of land and additions on the property. | Land | Improvement |
|---|---|---|---|---|
| 2024 | $1,654 | $49,020 | $12,220 | $36,800 |
| 2023 | $1,655 | $49,020 | $12,220 | $36,800 |
| 2022 | $1,565 | $38,450 | $11,500 | $26,950 |
| 2021 | $1,649 | $38,450 | $11,500 | $26,950 |
| 2020 | $1,795 | $38,448 | $11,501 | $26,947 |
| 2019 | $1,063 | $33,359 | $10,185 | $23,174 |
| 2018 | $1,065 | $33,359 | $10,185 | $23,174 |
| 2017 | $1,099 | $33,359 | $10,185 | $23,174 |
| 2016 | $1,134 | $35,329 | $9,982 | $25,347 |
| 2015 | $1,121 | $35,329 | $9,982 | $25,347 |
| 2014 | $1,056 | $35,329 | $9,982 | $25,347 |
| 2013 | $1,125 | $36,050 | $10,185 | $25,865 |
Source: Public Records
Map
Nearby Homes
- 137 Hampden Park
- 43 Siesta Dr
- 284 Sycamore St
- 106 Sycamore Woods Ln
- 134 Saint Francis Ave
- 38 N Tecumseh Trail
- 19 Blue Bird Ln
- 135 Ella St
- 505 S Washington St
- 426 S Washington St
- 2465 S County Road 19
- 50 Gross St
- 185 Longfellow Dr
- 344 Circular St
- 125 W Woodmere Dr
- 81 Bryden Rd
- 2326 Ohio 231
- 295 Circular St
- 841 S Sandusky St
- 109 Rosa St