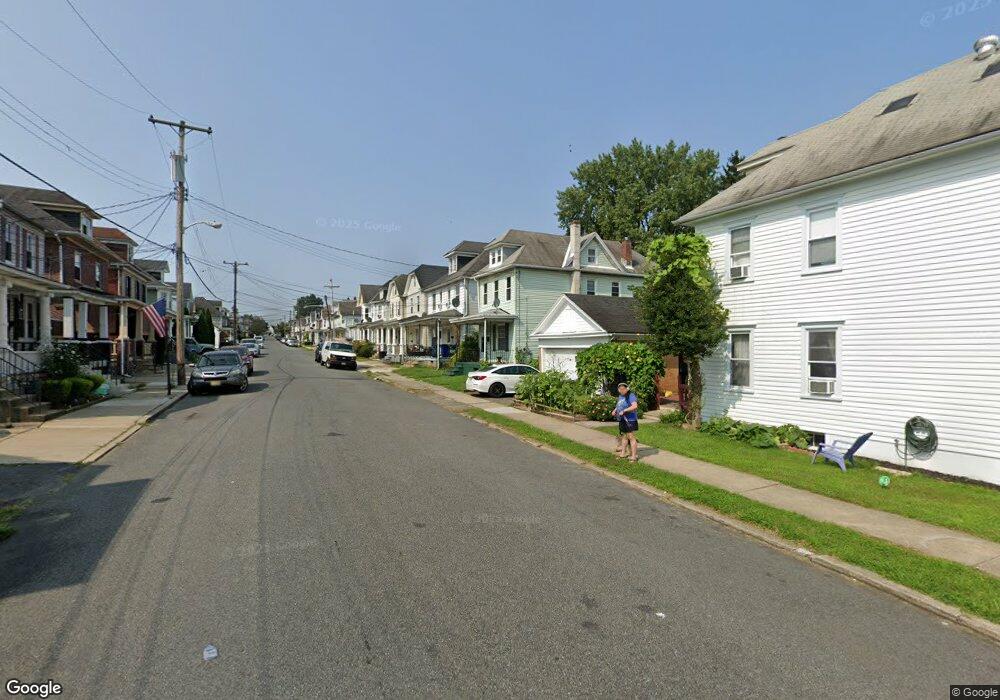
133 Glen Ave Phillipsburg, NJ 08865
Estimated Value: $220,000 - $260,000
--
Bed
--
Bath
1,376
Sq Ft
$174/Sq Ft
Est. Value
About This Home
This home is located at 133 Glen Ave, Phillipsburg, NJ 08865 and is currently estimated at $238,916, approximately $173 per square foot. 133 Glen Ave is a home located in Warren County with nearby schools including Phillipsburg High School, Easton Arts Academy Elementary Cs, and Sts. Philip & James School.
Ownership History
Date
Name
Owned For
Owner Type
Purchase Details
Closed on
Apr 6, 2012
Sold by
Singto Khampath and Singto Bountay
Bought by
Robbins Cynthia D
Current Estimated Value
Home Financials for this Owner
Home Financials are based on the most recent Mortgage that was taken out on this home.
Original Mortgage
$136,451
Outstanding Balance
$93,194
Interest Rate
3.75%
Mortgage Type
FHA
Estimated Equity
$145,722
Purchase Details
Closed on
Mar 25, 2003
Sold by
Pursell Kenneth M
Bought by
Singto Bountay and Singto Khampath
Create a Home Valuation Report for This Property
The Home Valuation Report is an in-depth analysis detailing your home's value as well as a comparison with similar homes in the area
Home Values in the Area
Average Home Value in this Area
Purchase History
| Date | Buyer | Sale Price | Title Company |
|---|---|---|---|
| Robbins Cynthia D | $147,000 | None Available | |
| Singto Bountay | $55,000 | -- |
Source: Public Records
Mortgage History
| Date | Status | Borrower | Loan Amount |
|---|---|---|---|
| Open | Robbins Cynthia D | $136,451 |
Source: Public Records
Tax History Compared to Growth
Tax History
| Year | Tax Paid | Tax Assessment Tax Assessment Total Assessment is a certain percentage of the fair market value that is determined by local assessors to be the total taxable value of land and additions on the property. | Land | Improvement |
|---|---|---|---|---|
| 2025 | $3,718 | $81,800 | $25,000 | $56,800 |
| 2024 | $3,432 | $81,800 | $25,000 | $56,800 |
| 2023 | $3,393 | $81,800 | $25,000 | $56,800 |
| 2022 | $3,393 | $81,800 | $25,000 | $56,800 |
| 2021 | $3,332 | $81,800 | $25,000 | $56,800 |
| 2020 | $3,306 | $81,800 | $25,000 | $56,800 |
| 2019 | $3,256 | $81,800 | $25,000 | $56,800 |
| 2018 | $3,256 | $81,800 | $25,000 | $56,800 |
| 2017 | $3,242 | $81,800 | $25,000 | $56,800 |
| 2016 | $3,192 | $81,800 | $25,000 | $56,800 |
| 2015 | $3,167 | $81,800 | $25,000 | $56,800 |
| 2014 | $3,064 | $81,800 | $25,000 | $56,800 |
Source: Public Records
Map
Nearby Homes