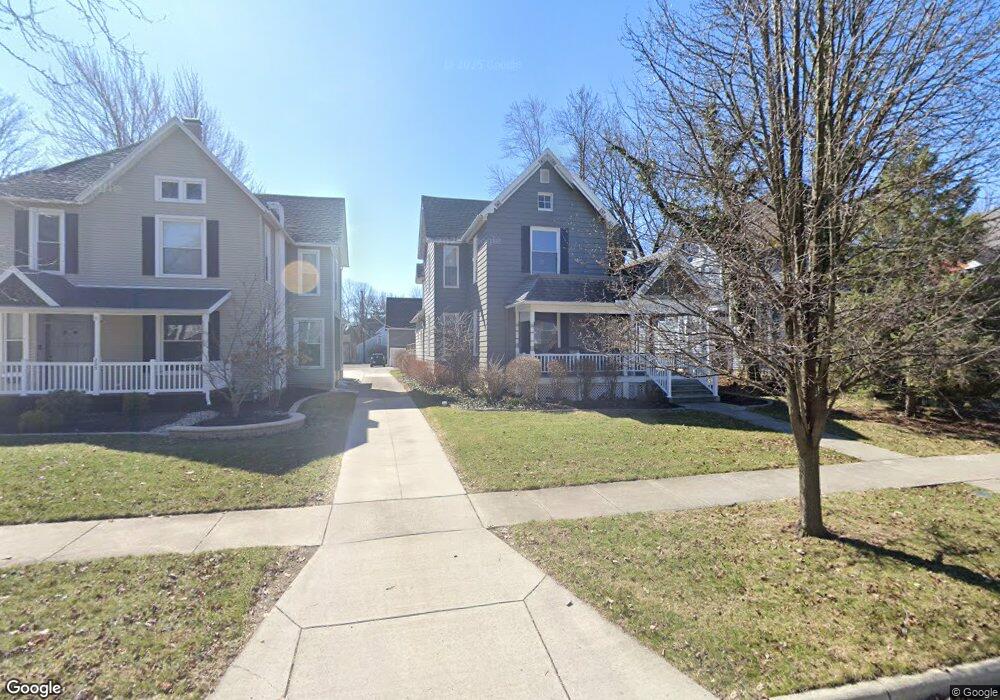
133 Hancock St Findlay, OH 45840
Estimated Value: $250,903 - $296,000
4
Beds
2
Baths
2,133
Sq Ft
$131/Sq Ft
Est. Value
About This Home
This home is located at 133 Hancock St, Findlay, OH 45840 and is currently estimated at $280,226, approximately $131 per square foot. 133 Hancock St is a home located in Hancock County with nearby schools including Lincoln Elementary School, Donnell Middle School, and Findlay High School.
Ownership History
Date
Name
Owned For
Owner Type
Purchase Details
Closed on
Feb 14, 2013
Sold by
Mitchell John E
Bought by
Mitchell John E and Mitchell Elicia L
Current Estimated Value
Purchase Details
Closed on
Jun 15, 2007
Sold by
Bright Gary D
Bought by
Mitchell John E
Home Financials for this Owner
Home Financials are based on the most recent Mortgage that was taken out on this home.
Original Mortgage
$123,200
Outstanding Balance
$75,426
Interest Rate
6.2%
Mortgage Type
Purchase Money Mortgage
Estimated Equity
$204,800
Purchase Details
Closed on
Aug 25, 1999
Sold by
Tischler Bruce
Bought by
Bright Gary and Bright Susan
Home Financials for this Owner
Home Financials are based on the most recent Mortgage that was taken out on this home.
Original Mortgage
$75,000
Interest Rate
7.61%
Mortgage Type
New Conventional
Purchase Details
Closed on
Feb 21, 1986
Bought by
Tischler Bruce E and Tischler Jean D
Create a Home Valuation Report for This Property
The Home Valuation Report is an in-depth analysis detailing your home's value as well as a comparison with similar homes in the area
Home Values in the Area
Average Home Value in this Area
Purchase History
| Date | Buyer | Sale Price | Title Company |
|---|---|---|---|
| Mitchell John E | -- | None Available | |
| Mitchell John E | $154,000 | Assured Title Agency | |
| Bright Gary | $115,000 | -- | |
| Tischler Bruce E | $64,900 | -- |
Source: Public Records
Mortgage History
| Date | Status | Borrower | Loan Amount |
|---|---|---|---|
| Open | Mitchell John E | $123,200 | |
| Previous Owner | Bright Gary | $75,000 |
Source: Public Records
Tax History Compared to Growth
Tax History
| Year | Tax Paid | Tax Assessment Tax Assessment Total Assessment is a certain percentage of the fair market value that is determined by local assessors to be the total taxable value of land and additions on the property. | Land | Improvement |
|---|---|---|---|---|
| 2024 | $2,377 | $66,880 | $7,480 | $59,400 |
| 2023 | $2,381 | $66,880 | $7,480 | $59,400 |
| 2022 | $2,372 | $66,880 | $7,480 | $59,400 |
| 2021 | $2,125 | $52,180 | $7,470 | $44,710 |
| 2020 | $2,125 | $52,180 | $7,470 | $44,710 |
| 2019 | $2,082 | $52,180 | $7,470 | $44,710 |
| 2018 | $1,826 | $41,950 | $5,970 | $35,980 |
| 2017 | $917 | $42,170 | $5,970 | $36,200 |
| 2016 | $1,812 | $42,170 | $5,970 | $36,200 |
| 2015 | $1,390 | $31,760 | $5,970 | $25,790 |
| 2014 | $1,390 | $31,760 | $5,970 | $25,790 |
| 2012 | $1,402 | $31,760 | $5,970 | $25,790 |
Source: Public Records
Map
Nearby Homes