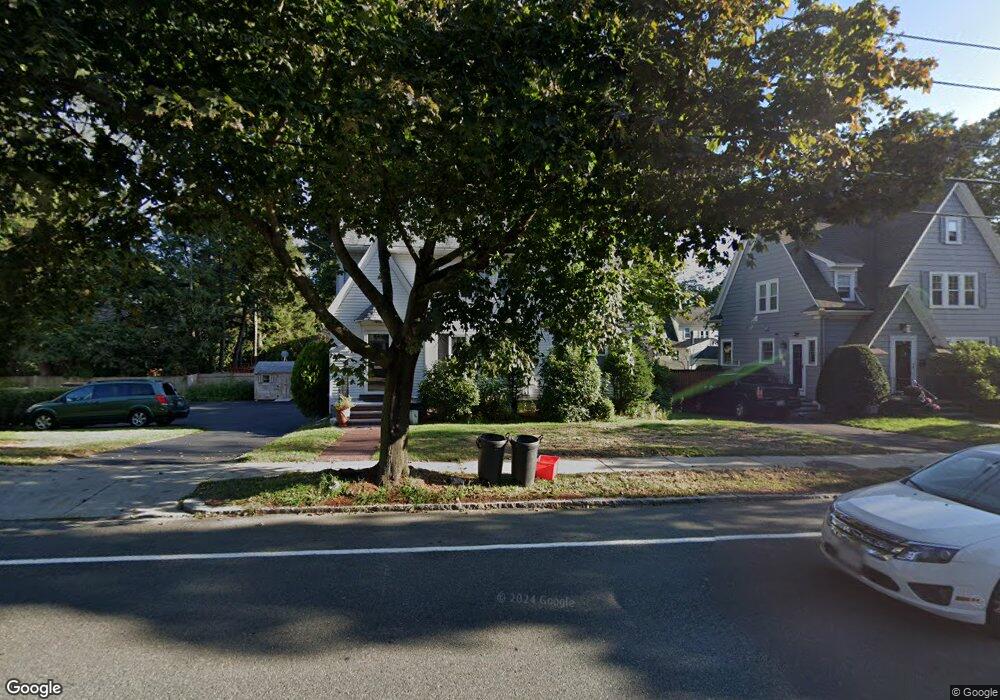
133 Howard St Melrose, MA 02176
Horace Mann NeighborhoodEstimated Value: $1,000,000 - $1,171,000
3
Beds
3
Baths
2,357
Sq Ft
$458/Sq Ft
Est. Value
About This Home
This home is located at 133 Howard St, Melrose, MA 02176 and is currently estimated at $1,080,609, approximately $458 per square foot. 133 Howard St is a home located in Middlesex County with nearby schools including Horace Mann Elementary School, Winthrop Elementary School, and Roosevelt Elementary School.
Ownership History
Date
Name
Owned For
Owner Type
Purchase Details
Closed on
Aug 4, 2004
Sold by
Yen John J and Quon Tammy N
Bought by
Sakhuja Deepak and Sakhuja Nisha
Current Estimated Value
Home Financials for this Owner
Home Financials are based on the most recent Mortgage that was taken out on this home.
Original Mortgage
$359,920
Interest Rate
6.2%
Mortgage Type
Purchase Money Mortgage
Purchase Details
Closed on
Mar 10, 2000
Sold by
Murphy Shawn E and Murphy Margaret C
Bought by
Yen John J and Quon Tammy N
Purchase Details
Closed on
Apr 25, 1997
Sold by
Difranco Robert and Gambacorta Zina
Bought by
Murphy Shawn E and Murphy Margaret C
Purchase Details
Closed on
Aug 10, 1993
Sold by
Vecchi Dennis J and Christina Vecchi M
Bought by
Difranco Robert and Gambacorta Zina
Purchase Details
Closed on
Nov 22, 1988
Sold by
Grant Charles L
Bought by
Vecchi Dennis J
Purchase Details
Closed on
May 28, 1987
Sold by
Smith Russell F
Bought by
Grant Charles L
Create a Home Valuation Report for This Property
The Home Valuation Report is an in-depth analysis detailing your home's value as well as a comparison with similar homes in the area
Home Values in the Area
Average Home Value in this Area
Purchase History
| Date | Buyer | Sale Price | Title Company |
|---|---|---|---|
| Sakhuja Deepak | $449,900 | -- | |
| Yen John J | $300,000 | -- | |
| Murphy Shawn E | $220,000 | -- | |
| Difranco Robert | $180,000 | -- | |
| Vecchi Dennis J | $199,000 | -- | |
| Grant Charles L | $100,000 | -- |
Source: Public Records
Mortgage History
| Date | Status | Borrower | Loan Amount |
|---|---|---|---|
| Open | Grant Charles L | $489,570 | |
| Closed | Sakhuja Deepak | $359,920 |
Source: Public Records
Tax History Compared to Growth
Tax History
| Year | Tax Paid | Tax Assessment Tax Assessment Total Assessment is a certain percentage of the fair market value that is determined by local assessors to be the total taxable value of land and additions on the property. | Land | Improvement |
|---|---|---|---|---|
| 2025 | $89 | $899,300 | $476,300 | $423,000 |
| 2024 | $8,795 | $885,700 | $462,700 | $423,000 |
| 2023 | $8,681 | $833,100 | $449,100 | $384,000 |
| 2022 | $8,237 | $779,300 | $408,300 | $371,000 |
| 2021 | $7,911 | $722,500 | $381,000 | $341,500 |
| 2020 | $7,984 | $722,500 | $381,000 | $341,500 |
| 2019 | $7,088 | $655,700 | $340,200 | $315,500 |
| 2018 | $6,890 | $608,100 | $292,600 | $315,500 |
| 2017 | $6,679 | $566,000 | $272,200 | $293,800 |
| 2016 | $6,652 | $539,500 | $272,200 | $267,300 |
| 2015 | $6,256 | $482,700 | $258,600 | $224,100 |
| 2014 | $6,048 | $455,400 | $231,300 | $224,100 |
Source: Public Records
Map
Nearby Homes
- 225 Howard St
- 128 Green St Unit 128
- 109 Linden Rd
- 22 Mount Zion Rd
- 65 Lincoln St
- 51 Melrose St Unit 1C
- 8 Crystal St Unit 2
- 8 Crystal St Unit 3
- 15 Shore Rd
- 218 Upham St
- 24 Ellsworth Ave
- 2 Overlook Rd
- 294 E Foster St
- 569 Franklin St Unit 1
- 906 Lewis o Gray Dr
- 445 E Foster St
- 515 Upham St
- 268 Laurel St
- 236-238 Main St
- 11 Larrabee St