Estimated Value: $214,031 - $298,000
2
Beds
1
Bath
880
Sq Ft
$275/Sq Ft
Est. Value
About This Home
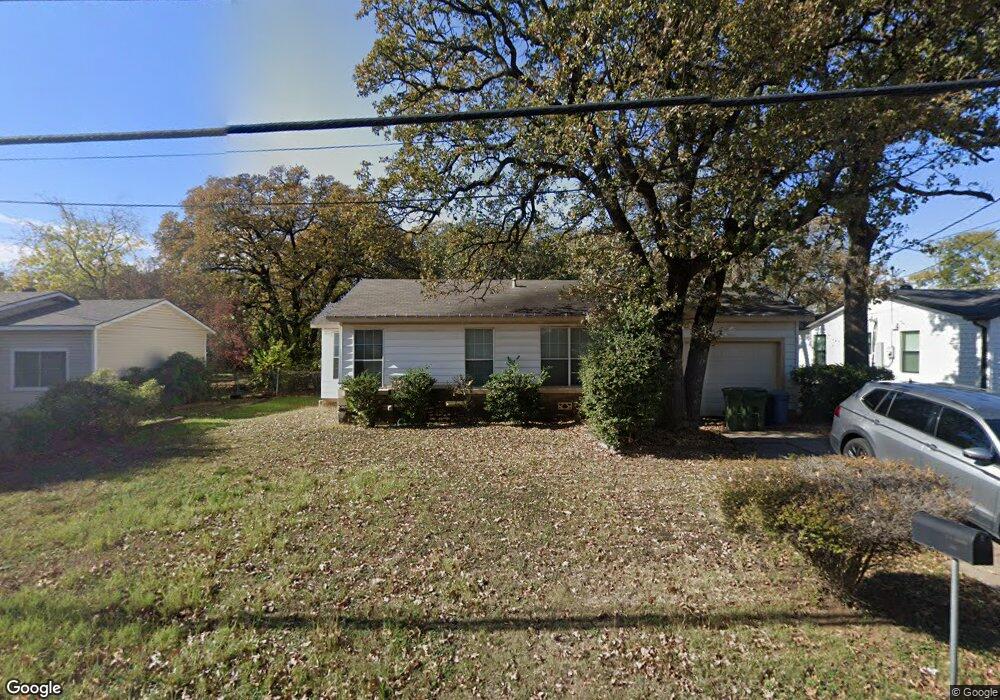
This home is located at 133 Hurstview Dr, Hurst, TX 76053 and is currently estimated at $242,258, approximately $275 per square foot. 133 Hurstview Dr is a home located in Tarrant County with nearby schools including West Hurst Elementary School, Hurst J High School, and L.D. Bell High School.
Ownership History
Date
Name
Owned For
Owner Type
Purchase Details
Closed on
Apr 29, 2005
Sold by
Mclean Fletcher C
Bought by
Morton James Kenneth
Current Estimated Value
Home Financials for this Owner
Home Financials are based on the most recent Mortgage that was taken out on this home.
Original Mortgage
$78,144
Outstanding Balance
$41,319
Interest Rate
6.06%
Mortgage Type
VA
Estimated Equity
$200,939
Purchase Details
Closed on
Mar 10, 2005
Sold by
Elledge Deborah Griffin and Griffin Deborah
Bought by
Ashford Catherine M and West Terry E
Home Financials for this Owner
Home Financials are based on the most recent Mortgage that was taken out on this home.
Original Mortgage
$78,144
Outstanding Balance
$41,319
Interest Rate
6.06%
Mortgage Type
VA
Estimated Equity
$200,939
Purchase Details
Closed on
Apr 29, 2004
Sold by
Elledge Deborah L
Bought by
Mclean Fletcher C
Purchase Details
Closed on
Jun 8, 2000
Sold by
Mclean Bruce R
Bought by
Elledge Deborah L
Create a Home Valuation Report for This Property
The Home Valuation Report is an in-depth analysis detailing your home's value as well as a comparison with similar homes in the area
Home Values in the Area
Average Home Value in this Area
Purchase History
| Date | Buyer | Sale Price | Title Company |
|---|---|---|---|
| Morton James Kenneth | -- | Reunion Title | |
| Ashford Catherine M | -- | First American Title | |
| Mclean Fletcher C | -- | -- | |
| Elledge Deborah L | -- | -- |
Source: Public Records
Mortgage History
| Date | Status | Borrower | Loan Amount |
|---|---|---|---|
| Open | Morton James Kenneth | $78,144 | |
| Previous Owner | Ashford Catherine M | $162,300 |
Source: Public Records
Tax History
| Year | Tax Paid | Tax Assessment Tax Assessment Total Assessment is a certain percentage of the fair market value that is determined by local assessors to be the total taxable value of land and additions on the property. | Land | Improvement |
|---|---|---|---|---|
| 2025 | $577 | $195,664 | $50,000 | $145,664 |
| 2024 | $577 | $195,664 | $50,000 | $145,664 |
| 2023 | $2,645 | $177,648 | $35,000 | $142,648 |
| 2022 | $2,764 | $154,647 | $35,000 | $119,647 |
| 2021 | $2,632 | $140,008 | $35,000 | $105,008 |
| 2020 | $2,387 | $124,558 | $35,000 | $89,558 |
| 2019 | $2,207 | $128,615 | $35,000 | $93,615 |
| 2018 | $1,530 | $81,990 | $19,000 | $62,990 |
| 2017 | $1,886 | $101,515 | $19,000 | $82,515 |
| 2016 | $1,715 | $103,534 | $19,000 | $84,534 |
| 2015 | $1,266 | $61,600 | $13,500 | $48,100 |
| 2014 | $1,266 | $61,600 | $13,500 | $48,100 |
Source: Public Records
Map
Nearby Homes
- 47 Donald Ct
- 637 Post Oak Dr
- 408 Harrison Ln
- 205 Corinna Ct
- 108 Donald Dr
- 608 W Redbud Dr
- 512 Shadowbrook Ln
- 260 Corinna Ct
- 408 Simmons Dr
- 416 Simmons Dr
- 528 Buena Vista Dr
- 424 Holder Dr
- 312 E Ellen Ave
- 780 Betty Ln
- 800 Treadwell Ct Unit 800B
- 231 Elm St
- 709 Hurstview Dr
- 552 Norwood Dr
- 808 Betty Ct
- 756 Briarwood Ln
- 137 Hurstview Dr
- 129 Hurstview Dr
- 136 Arthur Dr
- 140 Arthur Dr
- 132 Arthur Dr
- 201 Hurstview Dr
- 121 Hurstview Dr
- 140 Hurstview Dr
- 124 Arthur Dr
- 202 Arthur Dr
- 205 Hurstview Dr
- 120 Arthur Dr
- 117 Hurstview Dr
- 200 Hurstview Dr
- 204 Arthur Dr
- 116 Arthur Dr
- 209 Hurstview Dr
- 204 Hurstview Dr
- 129 Souder Dr
- 208 Arthur Dr
Your Personal Tour Guide
Ask me questions while you tour the home.