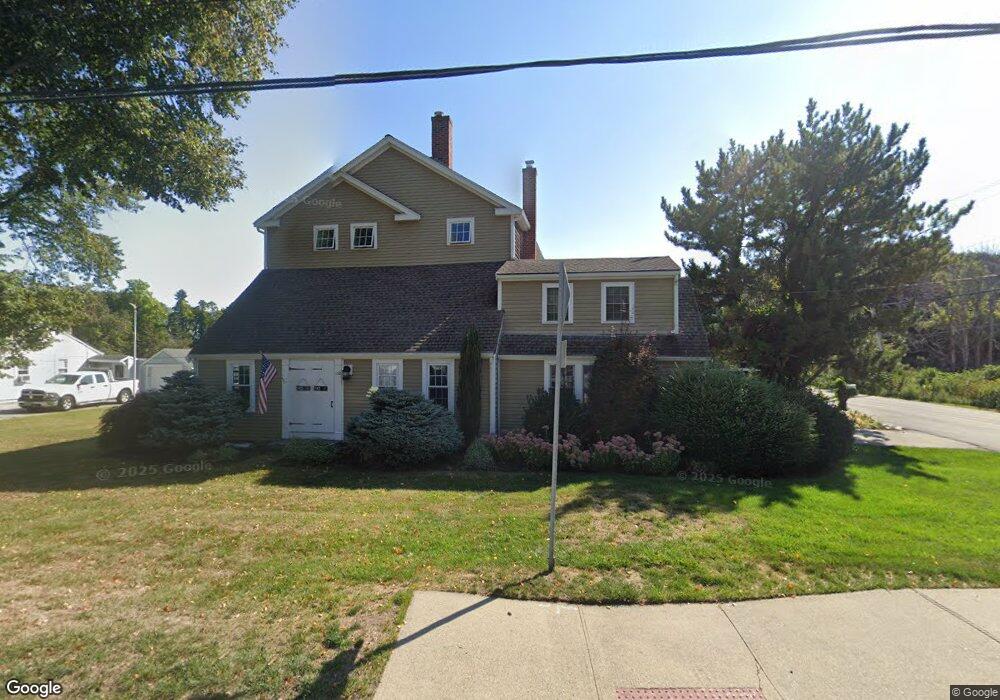
133 Kent St Scituate, MA 02066
Estimated Value: $1,373,000 - $1,499,000
3
Beds
1
Bath
1,573
Sq Ft
$912/Sq Ft
Est. Value
About This Home
This home is located at 133 Kent St, Scituate, MA 02066 and is currently estimated at $1,434,523, approximately $911 per square foot. 133 Kent St is a home located in Plymouth County with nearby schools including Jenkins Elementary School, Lester J. Gates Middle School, and Scituate High School.
Ownership History
Date
Name
Owned For
Owner Type
Purchase Details
Closed on
Sep 14, 2020
Sold by
King Robert F and Curley Paula M
Bought by
King Robert F and King Paula M
Current Estimated Value
Home Financials for this Owner
Home Financials are based on the most recent Mortgage that was taken out on this home.
Original Mortgage
$441,000
Outstanding Balance
$387,786
Interest Rate
2.9%
Mortgage Type
New Conventional
Estimated Equity
$1,046,737
Create a Home Valuation Report for This Property
The Home Valuation Report is an in-depth analysis detailing your home's value as well as a comparison with similar homes in the area
Home Values in the Area
Average Home Value in this Area
Purchase History
| Date | Buyer | Sale Price | Title Company |
|---|---|---|---|
| King Robert F | -- | None Available |
Source: Public Records
Mortgage History
| Date | Status | Borrower | Loan Amount |
|---|---|---|---|
| Open | King Robert F | $441,000 |
Source: Public Records
Tax History
| Year | Tax Paid | Tax Assessment Tax Assessment Total Assessment is a certain percentage of the fair market value that is determined by local assessors to be the total taxable value of land and additions on the property. | Land | Improvement |
|---|---|---|---|---|
| 2025 | $12,082 | $1,209,400 | $573,900 | $635,500 |
| 2024 | $11,861 | $1,144,900 | $521,700 | $623,200 |
| 2023 | $10,396 | $1,026,400 | $440,400 | $586,000 |
| 2022 | $10,396 | $823,800 | $332,400 | $491,400 |
| 2021 | $10,032 | $752,600 | $316,600 | $436,000 |
| 2020 | $9,793 | $725,400 | $304,400 | $421,000 |
| 2019 | $9,380 | $682,700 | $285,400 | $397,300 |
| 2018 | $8,918 | $639,300 | $282,200 | $357,100 |
| 2017 | $8,502 | $603,400 | $260,500 | $342,900 |
| 2016 | $8,073 | $570,900 | $228,000 | $342,900 |
| 2015 | $7,336 | $560,000 | $217,100 | $342,900 |
Source: Public Records
Map
Nearby Homes
- 59 Greenfield Ln
- 55 Crescent Ave
- 50 First Parish Rd
- 91 Front St Unit 106
- 25 Morton Place
- 34 Ladds Way
- 46 Tilden Rd
- 21 Jenkins Place
- 23 Sunset Rd
- 14 Old Country Way Unit C
- 14 Old Country Way Unit B
- 19 Ford Place Unit 1
- 19 Ford Place Unit 2
- 11 Brookline Rd
- 38 Lauren Ln
- 32 Barker Rd Unit 3
- 17 Old Oaken Bucket Rd
- 98 Satuit Trail
- 111 Elm St
- 1 Washington Ln
Your Personal Tour Guide
Ask me questions while you tour the home.