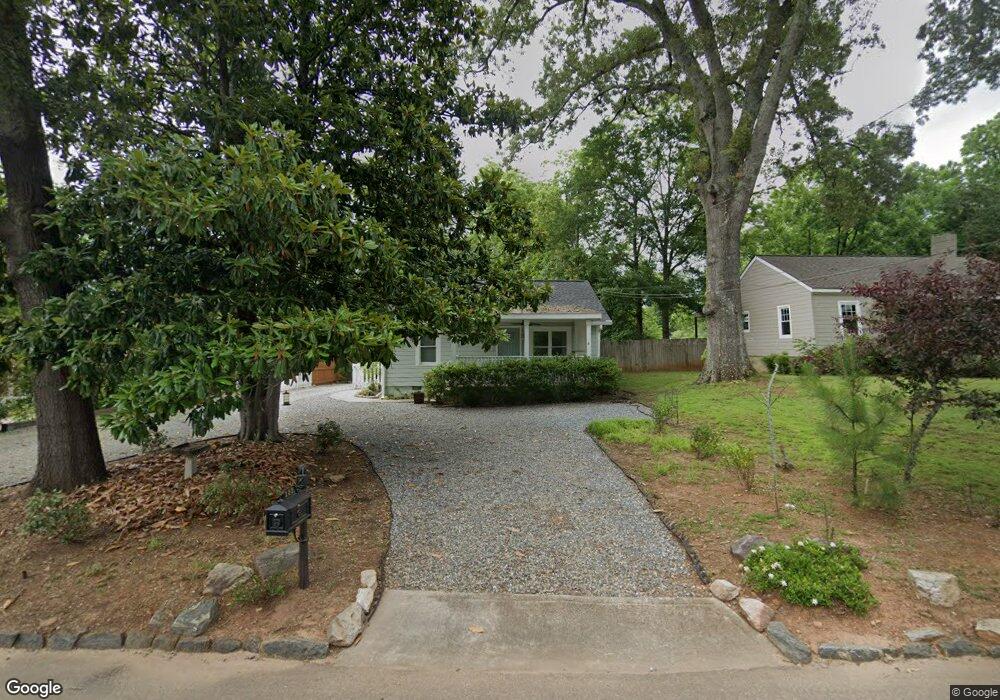
133 King St Unit A Roswell, GA 30075
Roswell Historic District NeighborhoodEstimated Value: $437,000 - $562,000
2
Beds
2
Baths
1,964
Sq Ft
$254/Sq Ft
Est. Value
About This Home
This home is located at 133 King St Unit A, Roswell, GA 30075 and is currently estimated at $498,076, approximately $253 per square foot. 133 King St Unit A is a home located in Fulton County with nearby schools including Roswell North Elementary School, Crabapple Middle School, and Roswell High School.
Ownership History
Date
Name
Owned For
Owner Type
Purchase Details
Closed on
Jan 20, 2009
Sold by
Gmac Mortgage Corp
Bought by
Medina J Siobhan
Current Estimated Value
Purchase Details
Closed on
Aug 5, 2008
Sold by
Alston Terence
Bought by
Gmac Mortgage Corp
Purchase Details
Closed on
Apr 12, 2005
Sold by
Kotey Napolean and Kotey Catherine
Bought by
Alston Terence
Home Financials for this Owner
Home Financials are based on the most recent Mortgage that was taken out on this home.
Original Mortgage
$121,500
Interest Rate
8.8%
Mortgage Type
New Conventional
Purchase Details
Closed on
Mar 12, 1998
Sold by
Blakeslee Steve
Bought by
Kotey Napolean
Home Financials for this Owner
Home Financials are based on the most recent Mortgage that was taken out on this home.
Original Mortgage
$64,775
Interest Rate
7.07%
Mortgage Type
New Conventional
Create a Home Valuation Report for This Property
The Home Valuation Report is an in-depth analysis detailing your home's value as well as a comparison with similar homes in the area
Home Values in the Area
Average Home Value in this Area
Purchase History
| Date | Buyer | Sale Price | Title Company |
|---|---|---|---|
| Medina J Siobhan | $55,000 | -- | |
| Gmac Mortgage Corp | $119,000 | -- | |
| Alston Terence | $135,000 | -- | |
| Kotey Napolean | $35,000 | -- |
Source: Public Records
Mortgage History
| Date | Status | Borrower | Loan Amount |
|---|---|---|---|
| Previous Owner | Alston Terence | $121,500 | |
| Previous Owner | Kotey Napolean | $64,775 |
Source: Public Records
Tax History Compared to Growth
Tax History
| Year | Tax Paid | Tax Assessment Tax Assessment Total Assessment is a certain percentage of the fair market value that is determined by local assessors to be the total taxable value of land and additions on the property. | Land | Improvement |
|---|---|---|---|---|
| 2025 | $888 | $139,160 | $93,320 | $45,840 |
| 2023 | $5,215 | $184,760 | $80,200 | $104,560 |
| 2022 | $3,278 | $124,600 | $41,520 | $83,080 |
| 2021 | $4,150 | $130,320 | $30,640 | $99,680 |
| 2020 | $4,215 | $128,720 | $30,240 | $98,480 |
| 2019 | $627 | $126,480 | $29,720 | $96,760 |
| 2018 | $3,486 | $123,520 | $29,040 | $94,480 |
| 2017 | $2,842 | $97,400 | $41,120 | $56,280 |
| 2016 | $2,842 | $97,400 | $41,120 | $56,280 |
| 2015 | $3,385 | $97,400 | $41,120 | $56,280 |
| 2014 | $2,986 | $97,400 | $41,120 | $56,280 |
Source: Public Records
Map
Nearby Homes
- 102 King St
- 400 Old Tree Trace
- 125 Spring Dr
- 383 Westside Dr Unit 13
- 383 Westside Dr
- 56 Pine St
- 49 Sloan St
- 815 Maplewood Dr
- 285 Roswell Farms Dr
- 530 Neel Reid Dr
- 53 Maple St
- 69 Maple St
- 9660 Loblolly Ln
- 3120 Overland Dr
- 3330 Overland Dr
- 420 Longleaf Dr
- 164 Oxbo Rd
- 217 Skyland Dr
- 545 Longleaf Dr Unit 1
- 307 Warm Springs Cir