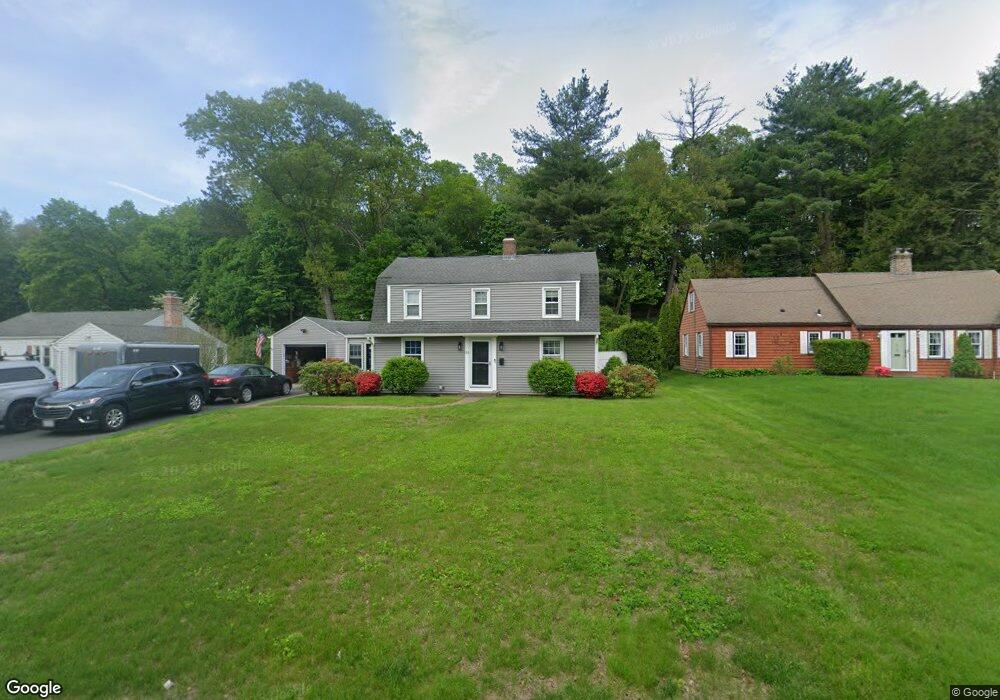
133 Laurel Rd West Springfield, MA 01089
Estimated Value: $364,090 - $408,000
3
Beds
2
Baths
1,518
Sq Ft
$252/Sq Ft
Est. Value
About This Home
This home is located at 133 Laurel Rd, West Springfield, MA 01089 and is currently estimated at $383,023, approximately $252 per square foot. 133 Laurel Rd is a home located in Hampden County with nearby schools including West Springfield High School and St Thomas The Apostle School.
Ownership History
Date
Name
Owned For
Owner Type
Purchase Details
Closed on
Aug 27, 2015
Sold by
Vigliano James P and Vigliano Linda C
Bought by
Boucher Marc P
Current Estimated Value
Purchase Details
Closed on
Nov 28, 2012
Sold by
Boucher Marc P and Boucher Kim M
Bought by
Boucher Marc P and Boucher Kim M
Purchase Details
Closed on
May 29, 1998
Sold by
Est Niksa Helen A and Banach Matthew J
Bought by
Boucher Marc C and Boucher Kim M
Home Financials for this Owner
Home Financials are based on the most recent Mortgage that was taken out on this home.
Original Mortgage
$113,050
Interest Rate
7.12%
Mortgage Type
Purchase Money Mortgage
Create a Home Valuation Report for This Property
The Home Valuation Report is an in-depth analysis detailing your home's value as well as a comparison with similar homes in the area
Home Values in the Area
Average Home Value in this Area
Purchase History
| Date | Buyer | Sale Price | Title Company |
|---|---|---|---|
| Boucher Marc P | -- | -- | |
| Boucher Marc P | -- | -- | |
| Boucher Marc C | $119,000 | -- |
Source: Public Records
Mortgage History
| Date | Status | Borrower | Loan Amount |
|---|---|---|---|
| Previous Owner | Boucher Marc C | $113,050 |
Source: Public Records
Tax History
| Year | Tax Paid | Tax Assessment Tax Assessment Total Assessment is a certain percentage of the fair market value that is determined by local assessors to be the total taxable value of land and additions on the property. | Land | Improvement |
|---|---|---|---|---|
| 2025 | $4,568 | $307,200 | $127,000 | $180,200 |
| 2024 | $4,348 | $293,600 | $127,000 | $166,600 |
| 2023 | $4,204 | $270,500 | $127,000 | $143,500 |
| 2022 | $3,850 | $244,300 | $115,300 | $129,000 |
| 2021 | $3,743 | $221,500 | $107,500 | $114,000 |
| 2020 | $3,739 | $220,100 | $107,500 | $112,600 |
| 2019 | $3,733 | $220,100 | $107,500 | $112,600 |
| 2018 | $3,753 | $220,100 | $107,500 | $112,600 |
| 2017 | $3,753 | $220,100 | $107,500 | $112,600 |
| 2016 | $3,706 | $218,100 | $103,300 | $114,800 |
| 2015 | $3,632 | $213,800 | $101,200 | $112,600 |
| 2014 | $882 | $213,800 | $101,200 | $112,600 |
Source: Public Records
Map
Nearby Homes
Your Personal Tour Guide
Ask me questions while you tour the home.