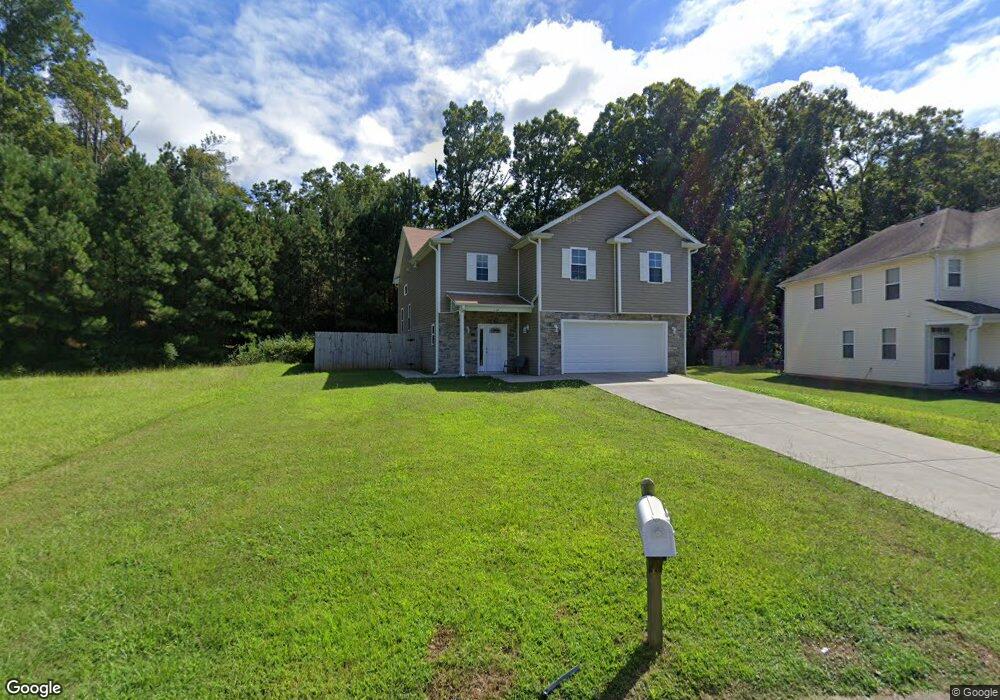
133 Lodestone Dr Unit 163 Durham, NC 27703
Eastern Durham NeighborhoodEstimated Value: $396,000 - $452,000
4
Beds
3
Baths
1,980
Sq Ft
$220/Sq Ft
Est. Value
About This Home
This home is located at 133 Lodestone Dr Unit 163, Durham, NC 27703 and is currently estimated at $435,182, approximately $219 per square foot. 133 Lodestone Dr Unit 163 is a home located in Durham County with nearby schools including Glenn Elementary, John W Neal Middle School, and Southern School of Energy & Sustainability.
Ownership History
Date
Name
Owned For
Owner Type
Purchase Details
Closed on
Sep 30, 2019
Sold by
North Carolina Housing And Const Inc
Bought by
Stone Nicholas Adrian
Current Estimated Value
Home Financials for this Owner
Home Financials are based on the most recent Mortgage that was taken out on this home.
Original Mortgage
$263,840
Outstanding Balance
$231,608
Interest Rate
3.6%
Mortgage Type
New Conventional
Estimated Equity
$203,574
Purchase Details
Closed on
Jan 2, 2018
Sold by
Guzman Martin and Amaya Lorena Esmeralda
Bought by
North Carolina Housing & Construction In
Purchase Details
Closed on
Dec 14, 2016
Sold by
Mfw Investments Llc
Bought by
Guzman Martin and Richardson Kim
Purchase Details
Closed on
Sep 12, 2016
Sold by
Durham Land Assoc Llc
Bought by
Mfw Investments Llc
Purchase Details
Closed on
Mar 30, 2007
Sold by
Durham Land Associates Llc
Bought by
Kb Home Raleigh Durham Inc
Create a Home Valuation Report for This Property
The Home Valuation Report is an in-depth analysis detailing your home's value as well as a comparison with similar homes in the area
Home Values in the Area
Average Home Value in this Area
Purchase History
| Date | Buyer | Sale Price | Title Company |
|---|---|---|---|
| Stone Nicholas Adrian | $272,000 | None Available | |
| North Carolina Housing & Construction In | -- | None Available | |
| Guzman Martin | $18,500 | -- | |
| Mfw Investments Llc | $20,000 | -- | |
| Kb Home Raleigh Durham Inc | $800,000 | None Available |
Source: Public Records
Mortgage History
| Date | Status | Borrower | Loan Amount |
|---|---|---|---|
| Open | Stone Nicholas Adrian | $263,840 |
Source: Public Records
Tax History Compared to Growth
Tax History
| Year | Tax Paid | Tax Assessment Tax Assessment Total Assessment is a certain percentage of the fair market value that is determined by local assessors to be the total taxable value of land and additions on the property. | Land | Improvement |
|---|---|---|---|---|
| 2025 | $5,484 | $553,201 | $110,700 | $442,501 |
| 2024 | $3,338 | $239,274 | $30,700 | $208,574 |
| 2023 | $3,134 | $239,274 | $30,700 | $208,574 |
| 2022 | $3,062 | $239,274 | $30,700 | $208,574 |
| 2021 | $2,955 | $231,931 | $30,700 | $201,231 |
| 2020 | $2,885 | $231,931 | $30,700 | $201,231 |
| 2019 | $382 | $30,700 | $30,700 | $0 |
| 2018 | $333 | $24,560 | $24,560 | $0 |
| 2017 | $331 | $24,560 | $24,560 | $0 |
| 2016 | $320 | $24,560 | $24,560 | $0 |
| 2015 | $459 | $33,142 | $33,142 | $0 |
| 2014 | $459 | $33,142 | $33,142 | $0 |
Source: Public Records
Map
Nearby Homes
- 521 Quartz Dr
- 416 Chivalry Dr
- 4 Hertford Place
- 3409 Judy Ave
- 612 Chivalry Dr
- 210 Stoney Creek Cir
- 59 Enesco Cir
- 3602 Turquoise Dr
- 10 Autrey Mill Cir
- 301 Sylvias Ct
- 650 Ganyard Farm Way Unit 5
- 405 S Mineral Springs Rd
- 912 Obsidian Way
- 2117 Fletchers Ridge Dr
- 110 Kindlewood Dr
- 10 Petersburg Place
- 506 Currin St
- 9 Petersburg Place
- 3615 Freeman Rd
- 106 Newberry Ln
- 133 Lodestone Dr
- 201 Lodestone Dr
- 203 Lodestone Dr
- 126 Lodestone Dr
- 200 Lodestone Dr
- 204 Lodestone Dr
- 205 Lodestone Dr
- 125 Lodestone Dr Unit 175
- 125 Lodestone Dr
- 122 Lodestone Dr
- 207 Lodestone Dr
- 212 Lodestone Dr
- 123 Lodestone Dr
- 209 Lodestone Dr
- 221 Lodestone Dr
- 120 Lodestone Dr
- 121 Lodestone Dr
- 214 Lodestone Dr
- 211 Lodestone Dr
- 215 Butler Rd