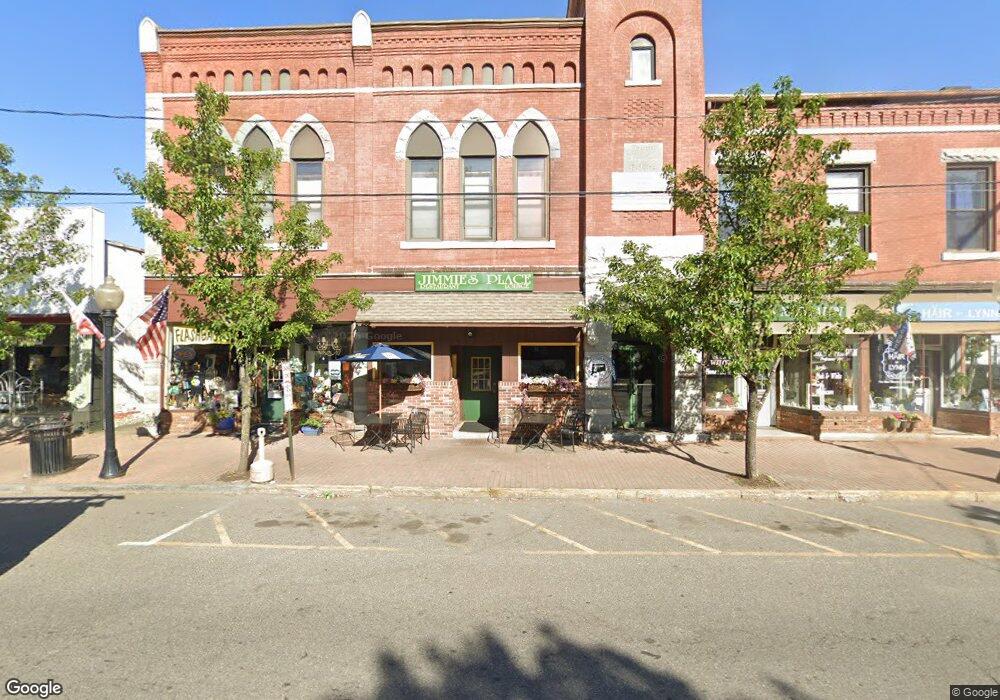
133 Main St Seymour, CT 06483
--
Bed
2
Baths
10,070
Sq Ft
5,663
Sq Ft Lot
About This Home
This home is located at 133 Main St, Seymour, CT 06483. 133 Main St is a home located in New Haven County with nearby schools including Seymour Middle School, Seymour High School, and Assumption School.
Ownership History
Date
Name
Owned For
Owner Type
Purchase Details
Closed on
Nov 4, 2022
Sold by
131-139 Main St Seymour
Bought by
133-139 Main St Llc
Home Financials for this Owner
Home Financials are based on the most recent Mortgage that was taken out on this home.
Original Mortgage
$383,600
Outstanding Balance
$371,151
Interest Rate
6.7%
Mortgage Type
Purchase Money Mortgage
Create a Home Valuation Report for This Property
The Home Valuation Report is an in-depth analysis detailing your home's value as well as a comparison with similar homes in the area
Home Values in the Area
Average Home Value in this Area
Purchase History
| Date | Buyer | Sale Price | Title Company |
|---|---|---|---|
| 133-139 Main St Llc | $548,000 | None Available | |
| 133-139 Main St Llc | $548,000 | None Available | |
| 133-139 Main St Llc | $548,000 | None Available |
Source: Public Records
Mortgage History
| Date | Status | Borrower | Loan Amount |
|---|---|---|---|
| Open | 133-139 Main St Llc | $383,600 | |
| Closed | 133-139 Main St Llc | $383,600 |
Source: Public Records
Tax History Compared to Growth
Tax History
| Year | Tax Paid | Tax Assessment Tax Assessment Total Assessment is a certain percentage of the fair market value that is determined by local assessors to be the total taxable value of land and additions on the property. | Land | Improvement |
|---|---|---|---|---|
| 2025 | $10,100 | $364,350 | $42,560 | $321,790 |
| 2024 | $12,512 | $339,640 | $41,020 | $298,620 |
| 2023 | $12,220 | $339,640 | $41,020 | $298,620 |
| 2022 | $12,088 | $339,640 | $41,020 | $298,620 |
| 2021 | $11,789 | $339,640 | $41,020 | $298,620 |
| 2020 | $12,169 | $338,030 | $39,410 | $298,620 |
| 2019 | $12,169 | $338,030 | $39,410 | $298,620 |
| 2018 | $12,169 | $338,030 | $39,410 | $298,620 |
| 2017 | $12,169 | $338,030 | $39,410 | $298,620 |
| 2016 | $12,169 | $338,030 | $39,410 | $298,620 |
| 2015 | $8,823 | $255,080 | $39,410 | $215,670 |
| 2014 | $8,683 | $255,080 | $39,410 | $215,670 |
Source: Public Records
Map
Nearby Homes