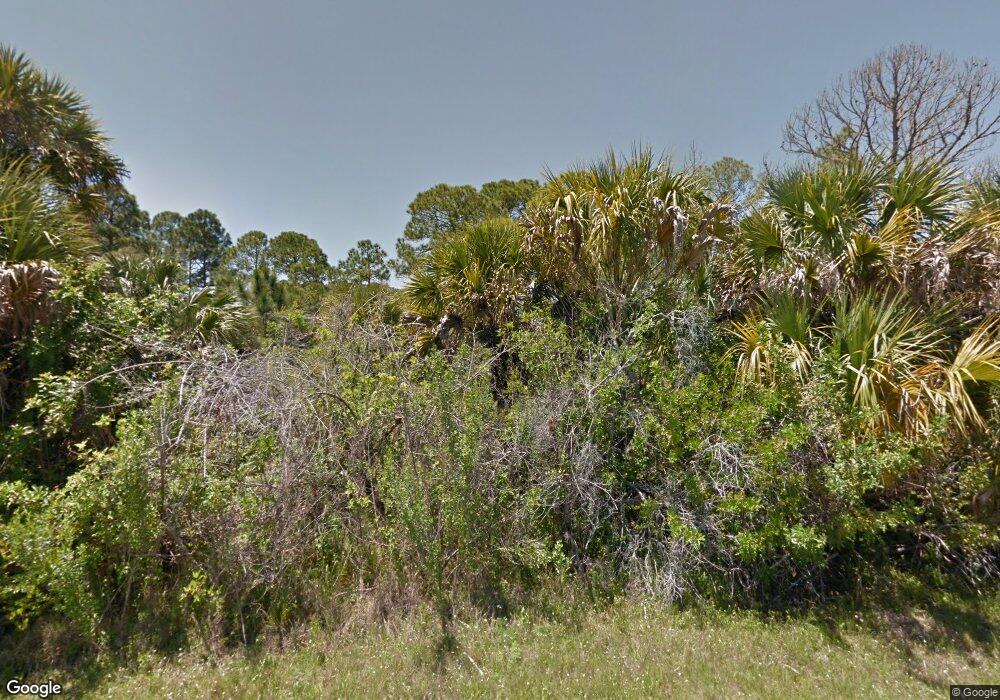
133 Maltby St Port Charlotte, FL 33953
Northwest Port Charlotte NeighborhoodEstimated Value: $69,000 - $228,000
--
Bed
--
Bath
--
Sq Ft
10,019
Sq Ft Lot
About This Home
This home is located at 133 Maltby St, Port Charlotte, FL 33953 and is currently estimated at $124,000. 133 Maltby St is a home located in Charlotte County with nearby schools including Liberty Elementary School, Murdock Middle School, and Port Charlotte High School.
Ownership History
Date
Name
Owned For
Owner Type
Purchase Details
Closed on
Jan 22, 2024
Sold by
Lifetime Properties Usa Llc
Bought by
Portal Osmany Romero
Current Estimated Value
Purchase Details
Closed on
Aug 7, 2019
Sold by
Shinder Emilia
Bought by
Lifetime Properties Usa Llc
Purchase Details
Closed on
Mar 12, 2012
Sold by
Shinder Anatoliy
Bought by
Shinder Emilia
Purchase Details
Closed on
Aug 18, 2005
Sold by
Simon Marc A and Simon Marie Denise
Bought by
Shinder Anatoliy
Purchase Details
Closed on
Aug 20, 2004
Sold by
New Vista Properties Inc
Bought by
Simon Marc A and Simon Marie Denise
Home Financials for this Owner
Home Financials are based on the most recent Mortgage that was taken out on this home.
Original Mortgage
$14,392
Interest Rate
10.9%
Mortgage Type
Seller Take Back
Purchase Details
Closed on
Aug 29, 2003
Sold by
Ramsey Harold Larry and Ramsey Alda G
Bought by
New Vista Prop Inc
Create a Home Valuation Report for This Property
The Home Valuation Report is an in-depth analysis detailing your home's value as well as a comparison with similar homes in the area
Home Values in the Area
Average Home Value in this Area
Purchase History
| Date | Buyer | Sale Price | Title Company |
|---|---|---|---|
| Portal Osmany Romero | $7,650 | None Listed On Document | |
| Lifetime Properties Usa Llc | $1,800 | Attorney | |
| Shinder Emilia | -- | None Available | |
| Shinder Anatoliy | $45,000 | Victory Title Llc | |
| Simon Marc A | $18,000 | -- | |
| Simon Marc A | $18,000 | -- | |
| New Vista Prop Inc | $7,900 | -- |
Source: Public Records
Mortgage History
| Date | Status | Borrower | Loan Amount |
|---|---|---|---|
| Previous Owner | Simon Marc A | $14,392 | |
| Previous Owner | Simon Marc A | $10,794 |
Source: Public Records
Tax History Compared to Growth
Tax History
| Year | Tax Paid | Tax Assessment Tax Assessment Total Assessment is a certain percentage of the fair market value that is determined by local assessors to be the total taxable value of land and additions on the property. | Land | Improvement |
|---|---|---|---|---|
| 2023 | $455 | $11,688 | $11,688 | $0 |
| 2022 | $430 | $10,200 | $10,200 | $0 |
| 2021 | $385 | $3,570 | $3,570 | $0 |
| 2020 | $377 | $3,570 | $3,570 | $0 |
| 2019 | $375 | $3,570 | $3,570 | $0 |
| 2018 | $365 | $3,315 | $3,315 | $0 |
| 2017 | $358 | $3,004 | $3,004 | $0 |
| 2016 | $354 | $2,876 | $0 | $0 |
| 2015 | $351 | $2,621 | $0 | $0 |
| 2014 | $249 | $2,602 | $0 | $0 |
Source: Public Records
Map
Nearby Homes
- 149 Maltby St
- 116 Hawke St
- 105 Monohan St
- 266 Hamden St
- 96 Hamden St
- 208 Portage St
- 203 Montana St
- 195 Montana St
- 12194 Dietrich Ave
- 97 Albritton St
- 80 Hamden St
- 89 Albritton St
- 12415 Mellon Ave
- 191 Ramblewood St
- 72 Pompano St
- 48 Ramblewood St
- 303 Redington Ave
- 234 Ramblewood St
- 88 Mordecal St
- 13179 Chancellor Blvd