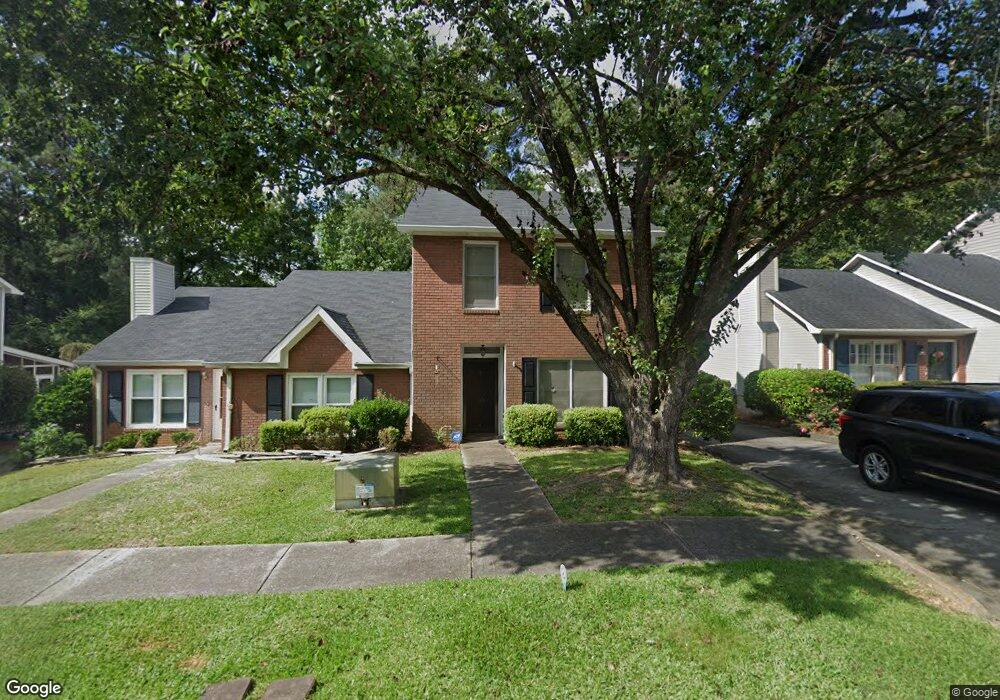
133 Manor Row Macon, GA 31210
Estimated Value: $134,000 - $162,000
2
Beds
2
Baths
1,096
Sq Ft
$137/Sq Ft
Est. Value
About This Home
This home is located at 133 Manor Row, Macon, GA 31210 and is currently estimated at $149,821, approximately $136 per square foot. 133 Manor Row is a home located in Bibb County with nearby schools including Carter Elementary School, Howard Middle School, and Howard High School.
Ownership History
Date
Name
Owned For
Owner Type
Purchase Details
Closed on
Jul 29, 2022
Sold by
Scholl Jay H
Bought by
Hinson Bryan
Current Estimated Value
Home Financials for this Owner
Home Financials are based on the most recent Mortgage that was taken out on this home.
Original Mortgage
$78,750
Outstanding Balance
$66,142
Interest Rate
4.81%
Mortgage Type
New Conventional
Estimated Equity
$83,679
Purchase Details
Closed on
Apr 24, 2017
Sold by
Scholl Jay H
Bought by
Scholl Jay H and Scholl Jessica S
Home Financials for this Owner
Home Financials are based on the most recent Mortgage that was taken out on this home.
Original Mortgage
$74,000
Interest Rate
4.23%
Mortgage Type
New Conventional
Purchase Details
Closed on
Jul 29, 2005
Sold by
Madray Angela V
Bought by
Scholl Jay H and Scholl Jon H
Home Financials for this Owner
Home Financials are based on the most recent Mortgage that was taken out on this home.
Original Mortgage
$95,950
Interest Rate
4.81%
Mortgage Type
Adjustable Rate Mortgage/ARM
Create a Home Valuation Report for This Property
The Home Valuation Report is an in-depth analysis detailing your home's value as well as a comparison with similar homes in the area
Purchase History
| Date | Buyer | Sale Price | Title Company |
|---|---|---|---|
| Hinson Bryan | $105,000 | None Listed On Document | |
| Scholl Jay H | -- | -- | |
| Scholl Jay H | $101,000 | None Available |
Source: Public Records
Mortgage History
| Date | Status | Borrower | Loan Amount |
|---|---|---|---|
| Open | Hinson Bryan | $78,750 | |
| Previous Owner | Scholl Jay H | $74,000 | |
| Previous Owner | Scholl Jay H | $95,950 |
Source: Public Records
Tax History
| Year | Tax Paid | Tax Assessment Tax Assessment Total Assessment is a certain percentage of the fair market value that is determined by local assessors to be the total taxable value of land and additions on the property. | Land | Improvement |
|---|---|---|---|---|
| 2025 | $1,308 | $53,236 | $8,000 | $45,236 |
| 2024 | $1,182 | $46,534 | $8,000 | $38,534 |
| 2023 | $1,230 | $41,508 | $8,000 | $33,508 |
| 2022 | $1,156 | $33,393 | $5,280 | $28,113 |
| 2021 | $1,141 | $30,020 | $5,280 | $24,740 |
| 2020 | $1,122 | $28,895 | $5,280 | $23,615 |
| 2019 | $1,131 | $28,895 | $5,280 | $23,615 |
| 2018 | $1,845 | $27,770 | $5,280 | $22,490 |
| 2017 | $938 | $25,041 | $4,800 | $20,241 |
| 2016 | $866 | $25,041 | $4,800 | $20,241 |
| 2015 | $1,484 | $30,297 | $6,300 | $23,997 |
| 2014 | $1,486 | $30,297 | $6,300 | $23,997 |
Source: Public Records
Map
Nearby Homes
- 113 Manor Row
- 331 Marjane Dr
- 5181 Zebulon Rd
- 5914 Huddersfield Rd
- 163 Broadleaf Dr
- 131 Ashford Park
- 137 Senora Place
- 567 Billingswood Dr
- 175 Rivoli Landing
- 103 Howard Oaks Dr
- 155 Howard Oaks Dr
- 181 Rivoli Landing
- 5104 Pine Ridge Dr
- 4860 Forsyth Rd
- 807 Wera Place
- 112 Covington Place
- 4939 Guerry Dr
- 670 Middlesex Dr
- 5341 Northside Dr
Your Personal Tour Guide
Ask me questions while you tour the home.