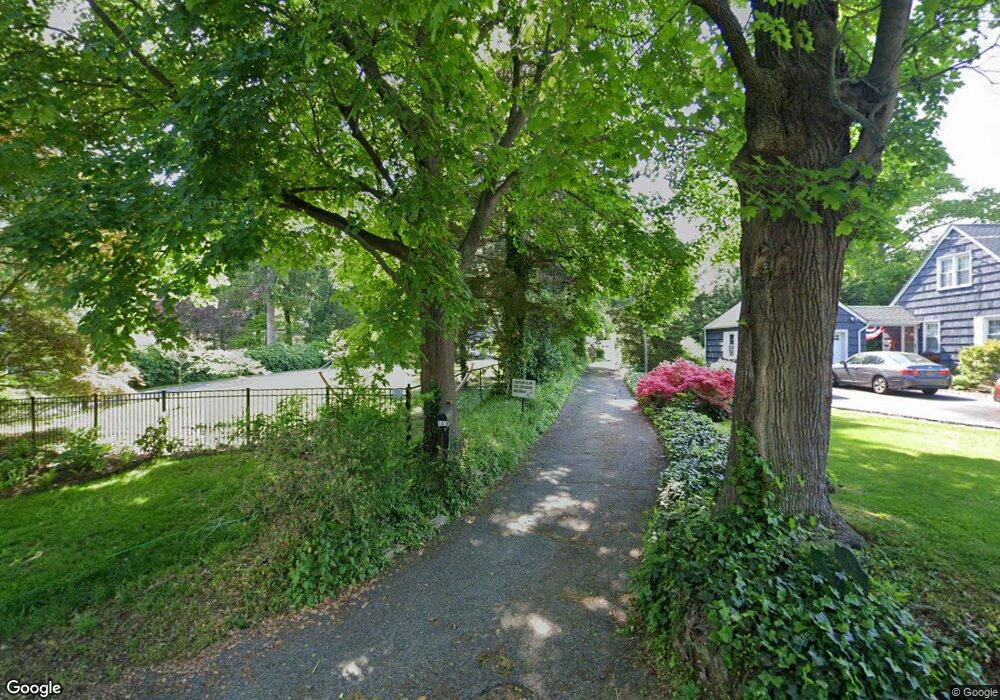
133 Maple Ave Northport, NY 11768
Estimated Value: $755,737 - $973,000
3
Beds
2
Baths
--
Sq Ft
30,056
Sq Ft Lot
About This Home
This home is located at 133 Maple Ave, Northport, NY 11768 and is currently estimated at $903,934. 133 Maple Ave is a home located in Suffolk County with nearby schools including Northport Senior High School, The School House, and Trinity Regional School-East Northport Campus.
Ownership History
Date
Name
Owned For
Owner Type
Purchase Details
Closed on
Jul 14, 2017
Sold by
Cole Laurence G
Bought by
Tantillo Thomas A and Collura Heather N
Current Estimated Value
Home Financials for this Owner
Home Financials are based on the most recent Mortgage that was taken out on this home.
Original Mortgage
$310,000
Outstanding Balance
$259,447
Interest Rate
4.16%
Mortgage Type
New Conventional
Estimated Equity
$644,487
Purchase Details
Closed on
Jan 30, 2008
Sold by
Cole Nancy J
Bought by
Cole Laurence G
Purchase Details
Closed on
Oct 18, 2001
Sold by
Cole Margaret L and Cole George A
Bought by
Cole Laurence G and Tucker Sally Cole
Create a Home Valuation Report for This Property
The Home Valuation Report is an in-depth analysis detailing your home's value as well as a comparison with similar homes in the area
Home Values in the Area
Average Home Value in this Area
Purchase History
| Date | Buyer | Sale Price | Title Company |
|---|---|---|---|
| Tantillo Thomas A | $560,000 | None Available | |
| Cole Laurence G | $398,000 | James Byrne | |
| Cole Laurence G | $398,000 | James Byrne | |
| Cole Laurence G | -- | -- | |
| Cole Laurence G | -- | -- |
Source: Public Records
Mortgage History
| Date | Status | Borrower | Loan Amount |
|---|---|---|---|
| Open | Tantillo Thomas A | $310,000 |
Source: Public Records
Tax History
| Year | Tax Paid | Tax Assessment Tax Assessment Total Assessment is a certain percentage of the fair market value that is determined by local assessors to be the total taxable value of land and additions on the property. | Land | Improvement |
|---|---|---|---|---|
| 2024 | $11,574 | $3,100 | $400 | $2,700 |
| 2023 | $3,917 | $3,100 | $400 | $2,700 |
| 2022 | $7,327 | $3,100 | $400 | $2,700 |
| 2021 | $7,026 | $3,100 | $400 | $2,700 |
| 2020 | $10,402 | $3,100 | $400 | $2,700 |
| 2019 | $17,309 | $0 | $0 | $0 |
| 2018 | $5,772 | $3,100 | $400 | $2,700 |
| 2017 | $5,772 | $3,100 | $400 | $2,700 |
| 2016 | $5,699 | $3,100 | $400 | $2,700 |
| 2015 | -- | $3,100 | $400 | $2,700 |
| 2014 | -- | $3,100 | $400 | $2,700 |
Source: Public Records
Map
Nearby Homes
- 11 Oxford St
- 66 Mar Kan Dr
- 116 Sea Cove Rd
- 49 Laurel St
- 76 Burt Ave
- 36 Burr Ave
- 127 Waterside Ave
- 2 Forester Ct
- 15 Dune Ct
- 107 Soper Ave
- lot Valley Ave
- 42 Norwood Rd
- 5 Ocean Ave
- 858 Fort Salonga Rd
- 180 Highland Ave
- 10 Moonedge Rd
- 28 Clipper Dr
- 147 Highland Ave
- 38 Soundcrest Ave
- 16 Fox Hollow Ridings Rd
Your Personal Tour Guide
Ask me questions while you tour the home.