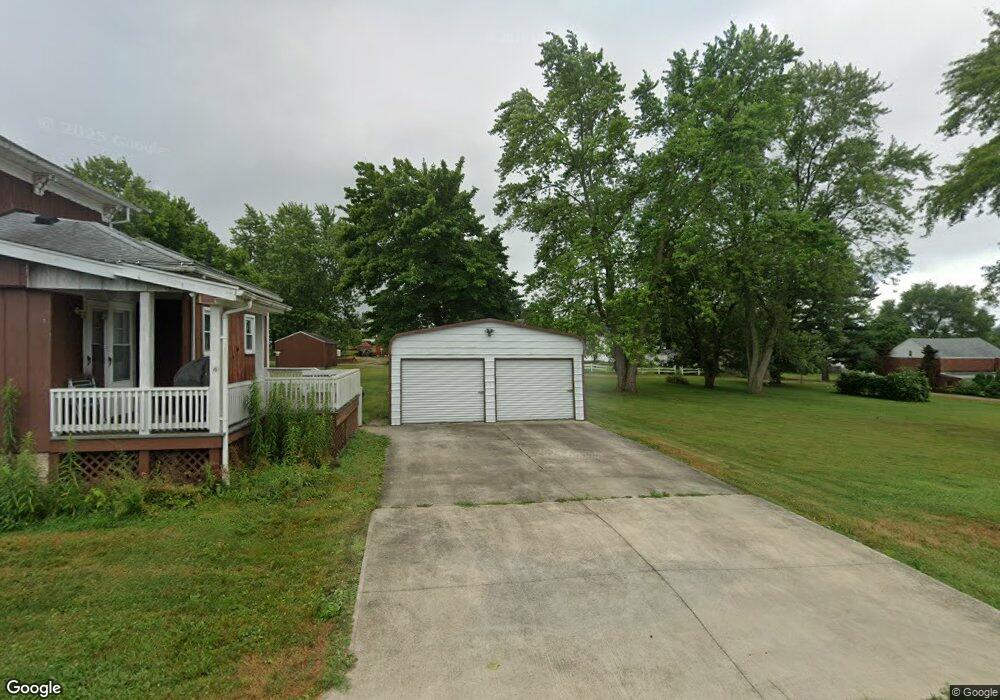
133 Market St N East Canton, OH 44730
Estimated Value: $136,435 - $204,000
3
Beds
2
Baths
1,701
Sq Ft
$103/Sq Ft
Est. Value
About This Home
This home is located at 133 Market St N, East Canton, OH 44730 and is currently estimated at $175,109, approximately $102 per square foot. 133 Market St N is a home located in Stark County with nearby schools including East Canton Elementary School, East Canton Middle School, and East Canton High School.
Ownership History
Date
Name
Owned For
Owner Type
Purchase Details
Closed on
Nov 29, 2011
Sold by
Delong Virginia L
Bought by
Barnes Thoms G
Current Estimated Value
Home Financials for this Owner
Home Financials are based on the most recent Mortgage that was taken out on this home.
Original Mortgage
$78,647
Outstanding Balance
$54,083
Interest Rate
4.12%
Mortgage Type
FHA
Estimated Equity
$121,026
Purchase Details
Closed on
Mar 12, 2008
Sold by
Estate Of Robert R Delong Sr
Bought by
Delong Virginia L
Create a Home Valuation Report for This Property
The Home Valuation Report is an in-depth analysis detailing your home's value as well as a comparison with similar homes in the area
Home Values in the Area
Average Home Value in this Area
Purchase History
| Date | Buyer | Sale Price | Title Company |
|---|---|---|---|
| Barnes Thoms G | $81,500 | Attorney | |
| Delong Virginia L | -- | None Available |
Source: Public Records
Mortgage History
| Date | Status | Borrower | Loan Amount |
|---|---|---|---|
| Open | Barnes Thoms G | $78,647 |
Source: Public Records
Tax History Compared to Growth
Tax History
| Year | Tax Paid | Tax Assessment Tax Assessment Total Assessment is a certain percentage of the fair market value that is determined by local assessors to be the total taxable value of land and additions on the property. | Land | Improvement |
|---|---|---|---|---|
| 2025 | -- | $39,350 | $11,170 | $28,180 |
| 2024 | -- | $39,350 | $11,170 | $28,180 |
| 2023 | $1,029 | $32,170 | $9,660 | $22,510 |
| 2022 | $998 | $32,170 | $9,660 | $22,510 |
| 2021 | $1,002 | $32,170 | $9,660 | $22,510 |
| 2020 | $948 | $28,600 | $8,610 | $19,990 |
| 2019 | $933 | $28,600 | $8,610 | $19,990 |
| 2018 | $926 | $28,600 | $8,610 | $19,990 |
| 2017 | $827 | $27,480 | $7,980 | $19,500 |
| 2016 | $642 | $23,210 | $7,980 | $15,230 |
| 2015 | $647 | $23,210 | $7,980 | $15,230 |
| 2014 | $529 | $19,470 | $6,690 | $12,780 |
| 2013 | $471 | $19,220 | $6,690 | $12,530 |
Source: Public Records
Map
Nearby Homes
- 223 Nassau St W
- 137 Noble St W
- 233 Nassau St W
- 225 - 227 Plum St N
- 0 Lincoln St SE Unit 5157308
- 0 Lincoln St SE Unit 5157344
- 0 Lincoln St SE Unit 5157290
- 2260 Broadway Ave NE
- 1527 Johns Ave SE
- 6416 15th St NE
- 4520 Georgetown Rd NE
- 6969 Georgetown St NE
- 2425 Miday Ave NE
- 2802 Trump Ave SE
- 1990 Belfort Ave
- 2923 Lincoln St E
- 7205 Mapleton St SE
- 3025 Orchardview Dr SE
- 2806 Pin Oak St NE
- 424 Whitetail Trail
- 217 Noble St W
- 209 Noble St W
- 132 Market St N
- 228 Noble St W
- 149 Noble St W
- 130 Market St N
- 207 Nassau St W
- 211 Nassau St W
- 233 Noble St W
- 221 Noble St W
- 234 Noble St W
- 220 Noble St W
- 149 Nassau St W
- 145 Nassau St W
- 238 Noble St W
- 237 Noble St W
- 137 Nassau St W
- 99 Market St N
- 128 Noble St W
- 97 Market St N