Estimated Value: $88,000 - $95,000
3
Beds
1
Bath
1,176
Sq Ft
$77/Sq Ft
Est. Value
About This Home
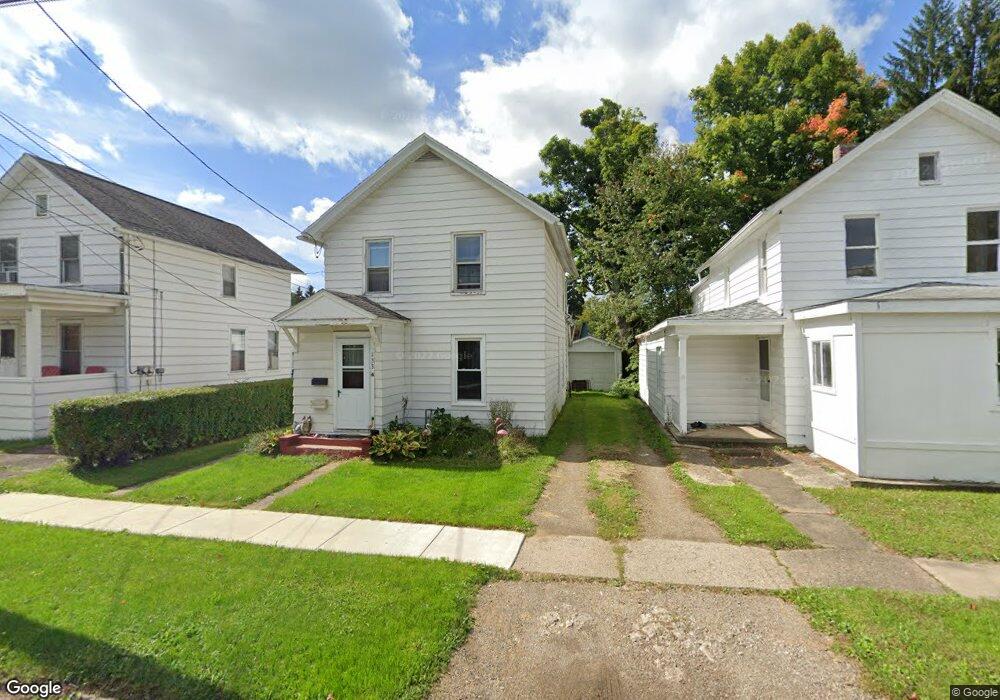
This home is located at 133 N 11th St, Olean, NY 14760 and is currently estimated at $90,997, approximately $77 per square foot. 133 N 11th St is a home located in Cattaraugus County with nearby schools including Olean Intermediate-Middle School, Olean Senior High School, and Southern Tier Catholic School.
Ownership History
Date
Name
Owned For
Owner Type
Purchase Details
Closed on
Apr 29, 2025
Sold by
Orcutt Patricia and Kayes Paul
Bought by
Orcutt Patricia
Current Estimated Value
Purchase Details
Closed on
May 12, 2021
Sold by
Orcutt Patricia
Bought by
Kayes Paul and Orcutt Patricia
Home Financials for this Owner
Home Financials are based on the most recent Mortgage that was taken out on this home.
Original Mortgage
$141,000
Interest Rate
3.7%
Mortgage Type
Stand Alone Refi Refinance Of Original Loan
Purchase Details
Closed on
Feb 16, 2010
Sold by
Dombek Estate Angeline
Bought by
Orcutt Patricia
Create a Home Valuation Report for This Property
The Home Valuation Report is an in-depth analysis detailing your home's value as well as a comparison with similar homes in the area
Home Values in the Area
Average Home Value in this Area
Purchase History
| Date | Buyer | Sale Price | Title Company |
|---|---|---|---|
| Orcutt Patricia | -- | None Available | |
| Kayes Paul | -- | None Available | |
| Orcutt Patricia | $34,000 | Daniel R Palumbo | |
| Orcutt Patricia | $34,000 | Daniel R Palumbo |
Source: Public Records
Mortgage History
| Date | Status | Borrower | Loan Amount |
|---|---|---|---|
| Previous Owner | Kayes Paul | $141,000 |
Source: Public Records
Tax History
| Year | Tax Paid | Tax Assessment Tax Assessment Total Assessment is a certain percentage of the fair market value that is determined by local assessors to be the total taxable value of land and additions on the property. | Land | Improvement |
|---|---|---|---|---|
| 2024 | $3,351 | $53,000 | $3,300 | $49,700 |
| 2023 | $1,995 | $53,000 | $3,300 | $49,700 |
| 2022 | $2,024 | $53,000 | $3,300 | $49,700 |
| 2021 | $2,083 | $53,000 | $3,300 | $49,700 |
| 2020 | $1,456 | $53,000 | $3,300 | $49,700 |
| 2019 | $796 | $53,000 | $3,300 | $49,700 |
| 2018 | $2,218 | $53,000 | $3,300 | $49,700 |
| 2017 | $1,472 | $53,000 | $3,300 | $49,700 |
| 2016 | $1,431 | $53,000 | $3,300 | $49,700 |
| 2015 | -- | $53,000 | $3,300 | $49,700 |
| 2014 | -- | $53,000 | $3,300 | $49,700 |
Source: Public Records
Map
Nearby Homes