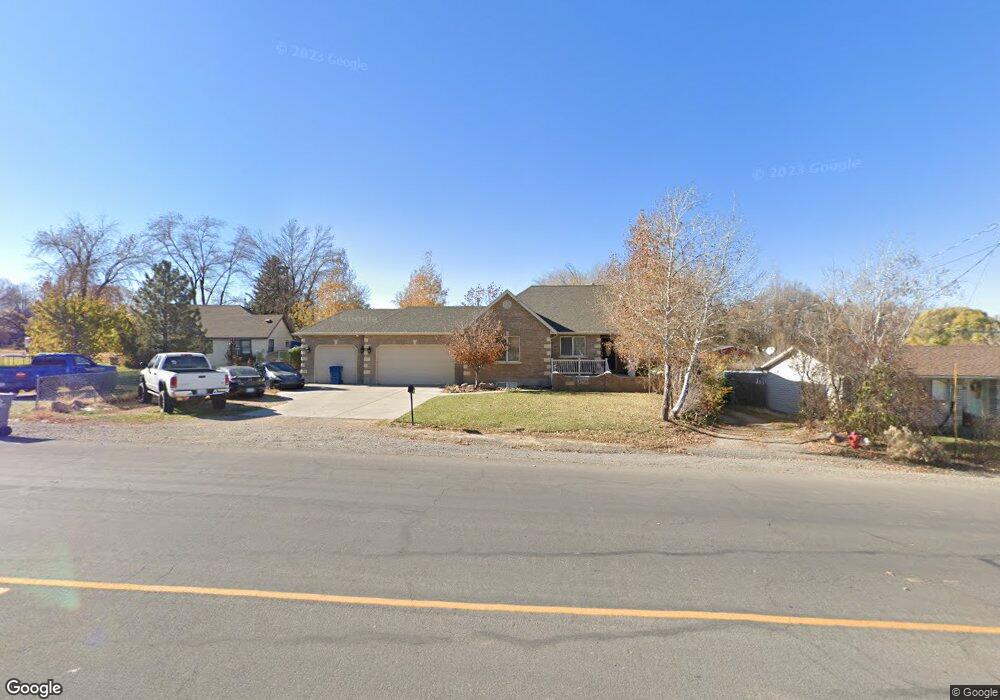
133 N 400 E Santaquin, UT 84655
Estimated Value: $642,000 - $676,946
4
Beds
4
Baths
4,204
Sq Ft
$157/Sq Ft
Est. Value
About This Home
This home is located at 133 N 400 E, Santaquin, UT 84655 and is currently estimated at $658,315, approximately $156 per square foot. 133 N 400 E is a home located in Utah County with nearby schools including Apple Valley Elementary, Payson Junior High School, and Mt. Nebo Middle.
Ownership History
Date
Name
Owned For
Owner Type
Purchase Details
Closed on
Nov 24, 2014
Sold by
Taylor Rena Mae and Rena Mae Taylor Trust
Bought by
Martin Michael
Current Estimated Value
Home Financials for this Owner
Home Financials are based on the most recent Mortgage that was taken out on this home.
Original Mortgage
$262,163
Outstanding Balance
$202,661
Interest Rate
4.25%
Mortgage Type
FHA
Estimated Equity
$455,654
Purchase Details
Closed on
Apr 2, 2014
Sold by
Taylor Rena Mae and Estate Of Golden Taylor
Bought by
Rena Mae Taqylor Trusts
Purchase Details
Closed on
Feb 17, 2014
Sold by
Taylor Rena Mae
Bought by
Taylor Rena Mae and Rena Mae Taylor Trust
Create a Home Valuation Report for This Property
The Home Valuation Report is an in-depth analysis detailing your home's value as well as a comparison with similar homes in the area
Home Values in the Area
Average Home Value in this Area
Purchase History
| Date | Buyer | Sale Price | Title Company |
|---|---|---|---|
| Martin Michael | -- | North American Title | |
| Rena Mae Taqylor Trusts | -- | None Available | |
| Taylor Rena Mae | -- | None Available |
Source: Public Records
Mortgage History
| Date | Status | Borrower | Loan Amount |
|---|---|---|---|
| Open | Martin Michael | $262,163 |
Source: Public Records
Tax History
| Year | Tax Paid | Tax Assessment Tax Assessment Total Assessment is a certain percentage of the fair market value that is determined by local assessors to be the total taxable value of land and additions on the property. | Land | Improvement |
|---|---|---|---|---|
| 2025 | $2,994 | $331,760 | -- | -- |
| 2024 | $2,994 | $298,155 | $0 | $0 |
| 2023 | $3,132 | $312,895 | $0 | $0 |
| 2022 | $2,932 | $302,115 | $0 | $0 |
| 2021 | $2,569 | $410,400 | $83,300 | $327,100 |
| 2020 | $2,471 | $382,400 | $72,400 | $310,000 |
| 2019 | $2,135 | $338,000 | $68,400 | $269,600 |
| 2018 | $2,031 | $306,600 | $64,400 | $242,200 |
| 2017 | $1,876 | $151,250 | $0 | $0 |
| 2016 | $1,793 | $141,680 | $0 | $0 |
| 2015 | $1,755 | $136,015 | $0 | $0 |
| 2014 | -- | $126,445 | $0 | $0 |
Source: Public Records
Map
Nearby Homes
Your Personal Tour Guide
Ask me questions while you tour the home.