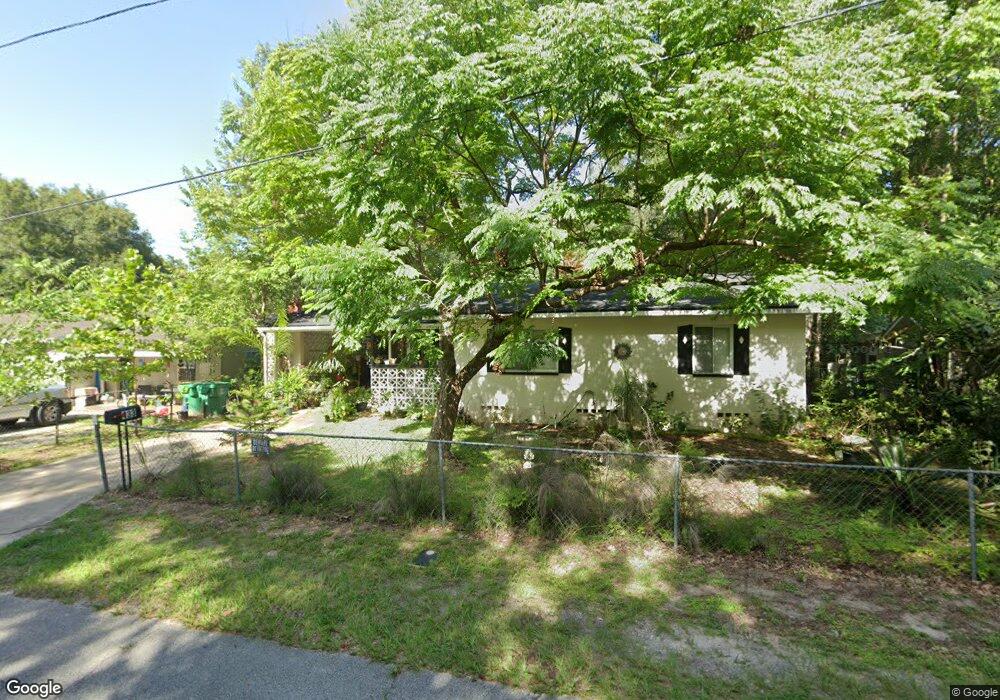
133 N Phippen Ave Deland, FL 32724
Estimated Value: $152,000 - $257,000
3
Beds
2
Baths
1,118
Sq Ft
$192/Sq Ft
Est. Value
About This Home
This home is located at 133 N Phippen Ave, Deland, FL 32724 and is currently estimated at $215,093, approximately $192 per square foot. 133 N Phippen Ave is a home located in Volusia County with nearby schools including Blue Lake Elementary School, Deland High School, and Deland Middle School.
Ownership History
Date
Name
Owned For
Owner Type
Purchase Details
Closed on
Dec 28, 2015
Sold by
Fannie Mae
Bought by
Hilligoss Lloyd R and The Lloyd R Hilligoss Trust
Current Estimated Value
Purchase Details
Closed on
Nov 3, 2015
Sold by
Miller Benjamin J
Bought by
Federal National Mortgage Association
Purchase Details
Closed on
Jul 14, 2005
Sold by
Litzinger Rodney
Bought by
Miller Benjamin J
Home Financials for this Owner
Home Financials are based on the most recent Mortgage that was taken out on this home.
Original Mortgage
$110,400
Interest Rate
5.87%
Mortgage Type
New Conventional
Purchase Details
Closed on
Oct 23, 2000
Sold by
Pancher Robin and Mott Robin
Bought by
Litzinger Rodney
Home Financials for this Owner
Home Financials are based on the most recent Mortgage that was taken out on this home.
Original Mortgage
$53,600
Interest Rate
7.82%
Mortgage Type
Purchase Money Mortgage
Purchase Details
Closed on
Jul 15, 1991
Bought by
Hilligoss Lloyd R Tr
Purchase Details
Closed on
Jul 15, 1990
Bought by
Hilligoss Lloyd R Tr
Create a Home Valuation Report for This Property
The Home Valuation Report is an in-depth analysis detailing your home's value as well as a comparison with similar homes in the area
Home Values in the Area
Average Home Value in this Area
Purchase History
| Date | Buyer | Sale Price | Title Company |
|---|---|---|---|
| Hilligoss Lloyd R | $69,900 | Stewart Lender Services | |
| Federal National Mortgage Association | $55,100 | None Available | |
| Miller Benjamin J | $138,000 | Westside Title Services Inc | |
| Litzinger Rodney | $53,600 | -- | |
| Hilligoss Lloyd R Tr | $100 | -- | |
| Hilligoss Lloyd R Tr | $46,500 | -- |
Source: Public Records
Mortgage History
| Date | Status | Borrower | Loan Amount |
|---|---|---|---|
| Previous Owner | Miller Benjamin J | $110,400 | |
| Previous Owner | Litzinger Rodney | $53,600 |
Source: Public Records
Tax History Compared to Growth
Tax History
| Year | Tax Paid | Tax Assessment Tax Assessment Total Assessment is a certain percentage of the fair market value that is determined by local assessors to be the total taxable value of land and additions on the property. | Land | Improvement |
|---|---|---|---|---|
| 2025 | $2,345 | $168,878 | $37,788 | $131,090 |
| 2024 | $2,345 | $170,106 | $37,788 | $132,318 |
| 2023 | $2,345 | $152,157 | $26,767 | $125,390 |
| 2022 | $2,194 | $142,802 | $25,822 | $116,980 |
| 2021 | $2,044 | $112,821 | $18,894 | $93,927 |
| 2020 | $1,872 | $103,718 | $15,745 | $87,973 |
| 2019 | $1,774 | $93,119 | $12,596 | $80,523 |
| 2018 | $1,666 | $82,318 | $8,817 | $73,501 |
| 2017 | $1,554 | $72,548 | $8,776 | $63,772 |
| 2016 | $1,344 | $58,518 | $0 | $0 |
| 2015 | $1,268 | $54,097 | $0 | $0 |
| 2014 | $1,174 | $48,336 | $0 | $0 |
Source: Public Records
Map
Nearby Homes
- 139 N Boston Ave
- 330 E Wisconsin Ave
- 1301 E Wisconsin Ave
- 0 E Wisconsin Ave Unit MFRO6190518
- 141 N McDonald Ave
- 137 S Chandler Ave
- 322 N Frankfort Ave
- 524 E Church St
- 401 N McDonald Ave
- 706 E Minnesota Ave Unit C
- 230 S Chandler Ave
- 419 N Frankfort Ave
- 109 S Colorado Ave
- 405 N McDonald Ave
- 437 N Boston Ave Unit 437
- 406 N Kentucky Ave
- 502 E Howry Ave
- 183 N Hill Ave Unit 90
- 239 N Hill Ave Unit 110
- 151 N Hill Ave Unit 100
- 135 N Phippen Ave
- 744 E Rich Ave
- 131 N Phippen Ave
- 716 E Rich Ave
- 735 E Indiana Ave
- 198 N Adams Ave
- 209 N Phippen Ave
- 712 E Rich Ave
- 745 E Rich Ave
- 127 N Phippen Ave
- 733 E Indiana Ave
- 715 E Rich Ave
- 713 E Rich Ave
- 708 E Rich Ave
- 705 E Indiana Ave
- 808 E Rich Ave
- 711 E Rich Ave
- 724 E Indiana Ave
- 125 N Adams Ave
- 706 E Rich Ave