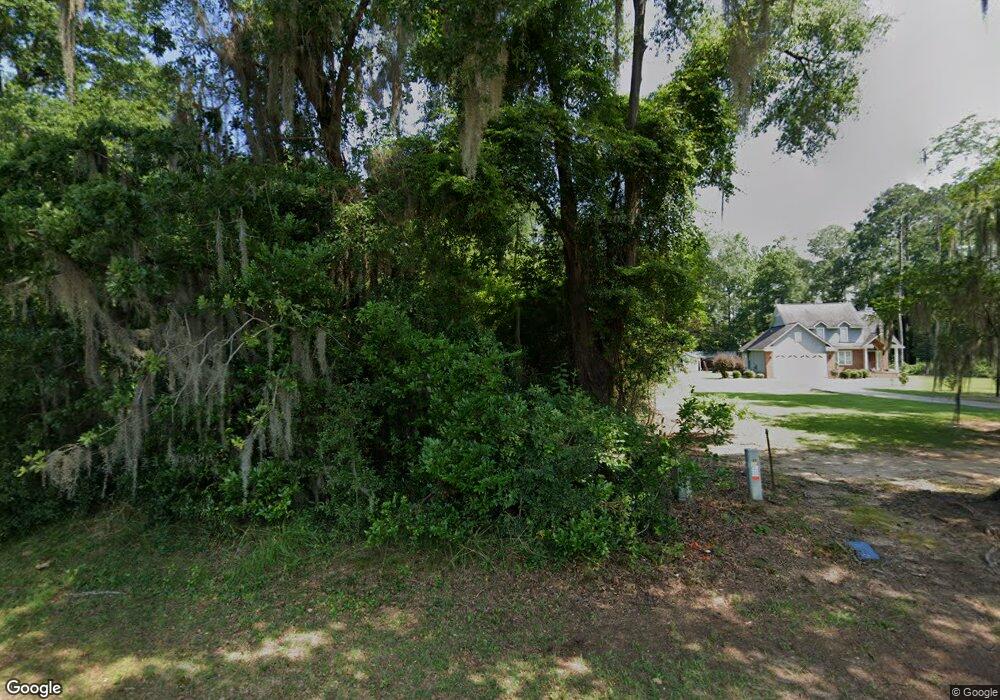
133 N Valhalla Ct Cordele, GA 31015
Estimated Value: $79,000 - $266,000
4
Beds
2
Baths
2,177
Sq Ft
$65/Sq Ft
Est. Value
About This Home
This home is located at 133 N Valhalla Ct, Cordele, GA 31015 and is currently estimated at $141,976, approximately $65 per square foot. 133 N Valhalla Ct is a home located in Crisp County with nearby schools including Crisp County Elementary School, Crisp County Primary School, and Crisp County Middle School.
Ownership History
Date
Name
Owned For
Owner Type
Purchase Details
Closed on
Jun 17, 2020
Sold by
Hammock Gail D
Bought by
Hammock Edward D
Current Estimated Value
Purchase Details
Closed on
May 9, 2016
Sold by
St Amand John
Bought by
Hammock Gail D
Home Financials for this Owner
Home Financials are based on the most recent Mortgage that was taken out on this home.
Original Mortgage
$9,000
Interest Rate
3.59%
Mortgage Type
New Conventional
Purchase Details
Closed on
Mar 31, 2010
Sold by
St Amand John
Bought by
Hammock Edward D and Hammock Lindsey Scott
Purchase Details
Closed on
Aug 23, 2005
Sold by
Hurt W Charles
Bought by
St Amand John and St Amand Nancy
Home Financials for this Owner
Home Financials are based on the most recent Mortgage that was taken out on this home.
Original Mortgage
$49,021
Interest Rate
5.71%
Mortgage Type
New Conventional
Purchase Details
Closed on
Apr 25, 1991
Bought by
Hurt Hurt W and Hurt Nina
Purchase Details
Closed on
Oct 19, 1981
Bought by
Folsom Randy M
Create a Home Valuation Report for This Property
The Home Valuation Report is an in-depth analysis detailing your home's value as well as a comparison with similar homes in the area
Home Values in the Area
Average Home Value in this Area
Purchase History
| Date | Buyer | Sale Price | Title Company |
|---|---|---|---|
| Hammock Edward D | -- | -- | |
| Hammock Gail D | $44,000 | -- | |
| Hammock Edward D | $57,500 | -- | |
| St Amand John | $60,000 | -- | |
| St Amand John | $60,000 | -- | |
| Hurt Hurt W | $36,000 | -- | |
| Folsom Randy M | $30,000 | -- |
Source: Public Records
Mortgage History
| Date | Status | Borrower | Loan Amount |
|---|---|---|---|
| Previous Owner | Hammock Gail D | $9,000 | |
| Previous Owner | St Amand John | $49,021 |
Source: Public Records
Tax History Compared to Growth
Tax History
| Year | Tax Paid | Tax Assessment Tax Assessment Total Assessment is a certain percentage of the fair market value that is determined by local assessors to be the total taxable value of land and additions on the property. | Land | Improvement |
|---|---|---|---|---|
| 2025 | $1,317 | $247,782 | $86,938 | $160,844 |
| 2024 | $1,317 | $48,630 | $48,630 | $0 |
| 2023 | $1,366 | $48,630 | $48,630 | $0 |
| 2022 | $630 | $22,422 | $22,422 | $0 |
| 2021 | $617 | $22,422 | $22,422 | $0 |
| 2020 | $666 | $22,422 | $22,422 | $0 |
| 2019 | $662 | $22,422 | $22,422 | $0 |
| 2018 | $778 | $25,411 | $25,411 | $0 |
| 2017 | $781 | $25,411 | $25,411 | $0 |
| 2016 | $780 | $25,411 | $25,411 | $0 |
| 2015 | -- | $25,411 | $25,411 | $0 |
| 2014 | -- | $25,411 | $25,411 | $0 |
| 2013 | -- | $25,411 | $25,411 | $0 |
Source: Public Records
Map
Nearby Homes
- 0 the Retreat at Valhalla N
- 117 N Valhalla Ln
- 0 Valhalla Rd S Unit 138510
- 241 Valhalla Rd S Unit LOT 1
- 241 Valhalla Rd S Unit LOT 4
- 241 Valhalla Rd S Unit LOT 2
- 241 Valhalla Rd S Unit LOT 3
- 177 N Valhalla Dr
- 132 Valhalla Rd S
- 100 Valhalla
- 126 N Valhalla Dr
- 120 Valhalla Rd
- 118 Valhalla Rd S
- 241 Valhalla Rd Lot 1
- 114 N Valhalla Dr
- 154 Cannon Branch Rd
- Lot # 18 Cannon Branch Rd
- Lot #35 Cannon Branch Rd
- Lot #32 Cannon Branch Rd
- Lot # 30 Cannon Branch Rd
- Lt 28 & N Valhalla Ct
- 00 N Valhalla Ct
- 0 N Valhalla Ct
- 125 N Valhalla Ct
- N N Valhalla Ct
- 130 N Valhalla Ct
- 122 N Valhalla Ct
- 124 N Valhalla Ct
- 126 N Valhalla Ln
- 139 N Valhalla Ct
- 116 N Valhalla Ct
- 107 N Valhalla Way
- 129 N Valhalla Ct
- N N Valhalla Ln
- 131 N Valhalla Ct
- 114 N Valhalla Ct
- 105 N Valhalla Way
- 132 N Valhalla Ct
- 134 N Valhalla Ln
- 135 N Valhalla Ct