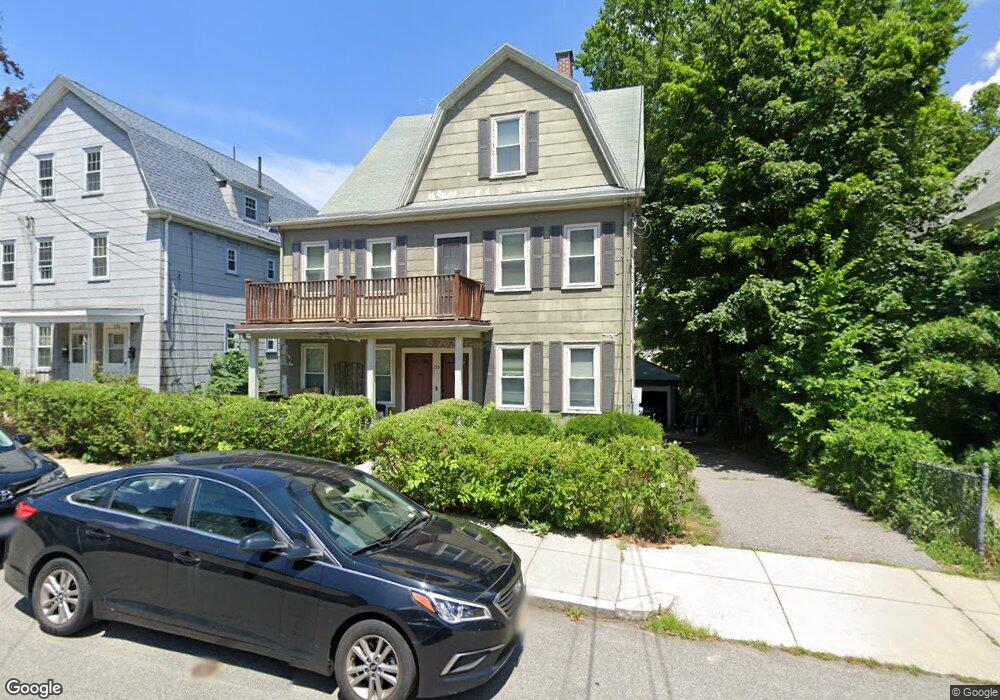
133 Nonantum St Unit 1 Brighton, MA 02135
Brighton NeighborhoodEstimated Value: $468,000 - $563,000
4
Beds
1
Bath
999
Sq Ft
$534/Sq Ft
Est. Value
About This Home
This home is located at 133 Nonantum St Unit 1, Brighton, MA 02135 and is currently estimated at $533,257, approximately $533 per square foot. 133 Nonantum St Unit 1 is a home located in Suffolk County with nearby schools including Newton Country Day School.
Ownership History
Date
Name
Owned For
Owner Type
Purchase Details
Closed on
May 10, 2004
Sold by
Nonantum St Condo 133
Bought by
Mcdonnell Meghan L and Mcdonald Meghan L
Current Estimated Value
Home Financials for this Owner
Home Financials are based on the most recent Mortgage that was taken out on this home.
Original Mortgage
$265,500
Outstanding Balance
$123,518
Interest Rate
5.39%
Mortgage Type
Purchase Money Mortgage
Estimated Equity
$409,739
Create a Home Valuation Report for This Property
The Home Valuation Report is an in-depth analysis detailing your home's value as well as a comparison with similar homes in the area
Home Values in the Area
Average Home Value in this Area
Purchase History
| Date | Buyer | Sale Price | Title Company |
|---|---|---|---|
| Mcdonnell Meghan L | $295,000 | -- |
Source: Public Records
Mortgage History
| Date | Status | Borrower | Loan Amount |
|---|---|---|---|
| Open | Mcdonnell Meghan L | $265,500 |
Source: Public Records
Tax History Compared to Growth
Tax History
| Year | Tax Paid | Tax Assessment Tax Assessment Total Assessment is a certain percentage of the fair market value that is determined by local assessors to be the total taxable value of land and additions on the property. | Land | Improvement |
|---|---|---|---|---|
| 2025 | $5,641 | $487,100 | $0 | $487,100 |
| 2024 | $5,157 | $473,100 | $0 | $473,100 |
| 2023 | $5,081 | $473,100 | $0 | $473,100 |
| 2022 | $4,903 | $450,600 | $0 | $450,600 |
| 2021 | $4,714 | $441,800 | $0 | $441,800 |
| 2020 | $4,513 | $427,400 | $0 | $427,400 |
| 2019 | $4,333 | $411,100 | $0 | $411,100 |
| 2018 | $4,123 | $393,400 | $0 | $393,400 |
| 2017 | $3,858 | $364,300 | $0 | $364,300 |
| 2016 | $3,816 | $346,900 | $0 | $346,900 |
| 2015 | $3,591 | $296,500 | $0 | $296,500 |
| 2014 | $3,388 | $269,300 | $0 | $269,300 |
Source: Public Records
Map
Nearby Homes
- 121 Tremont St Unit B1
- 99 Tremont St Unit 105
- 99 Tremont St Unit 413
- 21 Glenley Terrace
- 106 Farlow Rd
- 8 Tremont Place
- 70 Washington St Unit 70
- 70 Washington St
- 427-435 Faneuil St Unit R4
- 39 Champney St
- 18 Breck Ave Unit 18
- 206 Franklin St
- 22 Bigelow St
- 69 Presentation Rd
- 142 Kenrick St Unit 36
- 32-34 Larch St
- 34 Larch St Unit 34
- 32 Larch St Unit 34
- 180 Hunnewell Ave Unit 180
- 68 Vernon St
- 133 Nonantum St Unit 2
- 135-137 Nonantum St Unit 2
- 135-137 Nonantum St Unit 1
- 135 Nonantum St Unit 137
- 135 Nonantum St Unit 2
- 135 Nonantum St Unit 1
- 135 Nonantum St Unit T
- 135 Nonantum St
- 135 Nonantum St Unit 135
- 135 Nonantum St Unit 3
- 137 Nonantum St Unit 1
- 137 Nonantum St Unit 2
- 131 Nonantum St
- 131 Nonantum St Unit 1a
- 131 Nonantum St Unit 2
- 20 Cufflin St
- 153 Nonantum St
- 129 Nonantum St
- 129 Nonantum St Unit 1
- 160 Nonantum St Unit 162