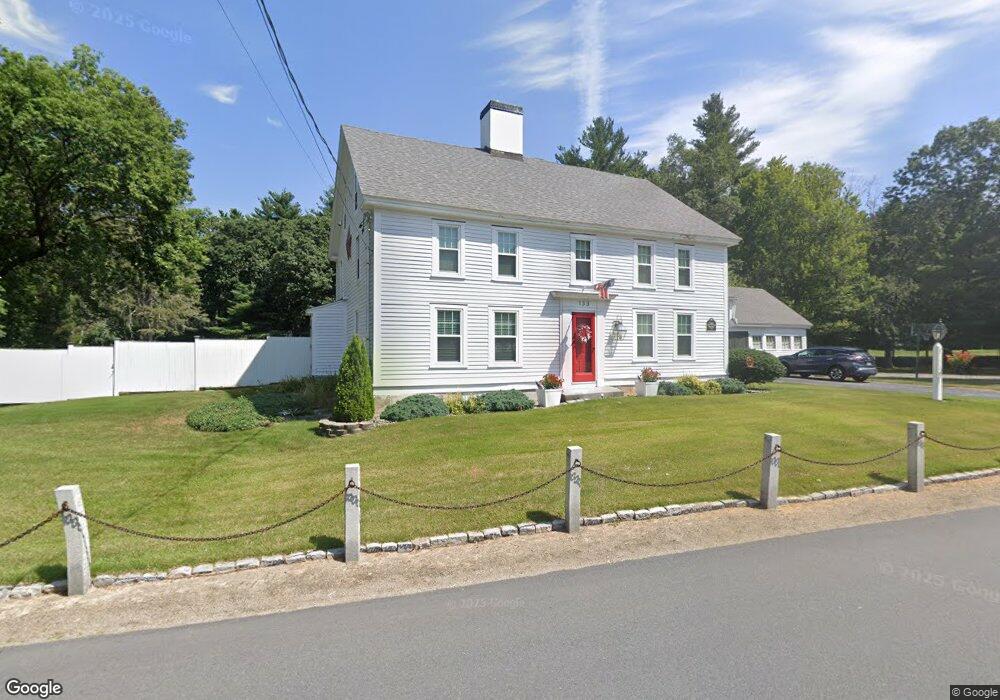
133 North St Methuen, MA 01844
The North End NeighborhoodEstimated Value: $751,000 - $894,000
4
Beds
3
Baths
2,834
Sq Ft
$283/Sq Ft
Est. Value
About This Home
This home is located at 133 North St, Methuen, MA 01844 and is currently estimated at $801,302, approximately $282 per square foot. 133 North St is a home located in Essex County with nearby schools including South Point Elementary School, Methuen High School, and The Birches Academy of Academics and Art.
Ownership History
Date
Name
Owned For
Owner Type
Purchase Details
Closed on
Oct 20, 2022
Sold by
Carroll Thomas J
Bought by
Carroll Thomas J and Trompke Alan B
Current Estimated Value
Purchase Details
Closed on
Sep 28, 2001
Sold by
Powers Joseph B and Morley Tracy S
Bought by
Carroll -Ii Thomas J and Carroll Erin L
Home Financials for this Owner
Home Financials are based on the most recent Mortgage that was taken out on this home.
Original Mortgage
$240,000
Interest Rate
6.91%
Mortgage Type
Purchase Money Mortgage
Purchase Details
Closed on
Feb 15, 2000
Sold by
Foster Jerry and Shaffer Marie E
Bought by
Powers Joseph B and Morley Tracy S
Purchase Details
Closed on
May 13, 1987
Sold by
True Isabel M
Bought by
Foster Jerry
Create a Home Valuation Report for This Property
The Home Valuation Report is an in-depth analysis detailing your home's value as well as a comparison with similar homes in the area
Home Values in the Area
Average Home Value in this Area
Purchase History
| Date | Buyer | Sale Price | Title Company |
|---|---|---|---|
| Carroll Thomas J | -- | None Available | |
| Carroll -Ii Thomas J | $330,000 | -- | |
| Powers Joseph B | $275,000 | -- | |
| Foster Jerry | $198,180 | -- |
Source: Public Records
Mortgage History
| Date | Status | Borrower | Loan Amount |
|---|---|---|---|
| Previous Owner | Foster Jerry | $250,000 | |
| Previous Owner | Foster Jerry | $75,000 | |
| Previous Owner | Foster Jerry | $240,000 |
Source: Public Records
Tax History Compared to Growth
Tax History
| Year | Tax Paid | Tax Assessment Tax Assessment Total Assessment is a certain percentage of the fair market value that is determined by local assessors to be the total taxable value of land and additions on the property. | Land | Improvement |
|---|---|---|---|---|
| 2025 | $7,904 | $747,100 | $275,800 | $471,300 |
| 2024 | $7,360 | $677,700 | $230,200 | $447,500 |
| 2023 | $7,096 | $606,500 | $230,100 | $376,400 |
| 2022 | $7,024 | $538,200 | $188,700 | $349,500 |
| 2021 | $6,963 | $527,900 | $178,400 | $349,500 |
| 2020 | $6,856 | $510,100 | $178,400 | $331,700 |
| 2019 | $6,458 | $455,100 | $168,000 | $287,100 |
| 2018 | $6,356 | $445,400 | $157,600 | $287,800 |
| 2017 | $6,153 | $420,000 | $157,600 | $262,400 |
| 2016 | $5,914 | $399,300 | $136,900 | $262,400 |
| 2015 | $5,706 | $390,800 | $136,900 | $253,900 |
Source: Public Records
Map
Nearby Homes
- 139 North St
- 20 Ashwood Ave
- 40 Stanwood Rd Unit 9
- 20 Stanwood Rd
- 35 Fraser Dr
- 74 Ayers Village Rd
- 1513 Broadway
- 47 Bailey Ct
- 6 Douglas Dr
- 1 Ballard Ln
- 10 Sally Sweets Way Unit V104
- 10 Evelyn Rd
- 25 Thayer St
- 257 Howe St
- 15 Linwood Ave
- 35 Linwood Ave
- 4 Mulberry Rd
- 1 Kimball Ave
- 17 Sawmill Ridge Rd
- 12 Cameron Way