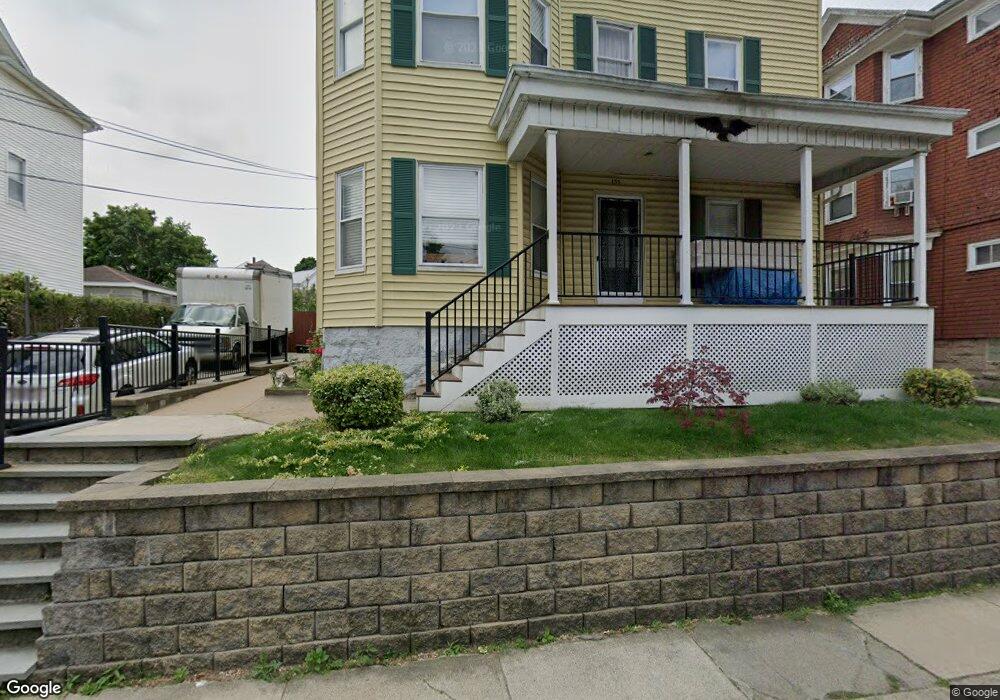
133 Osborn St Fall River, MA 02724
Father Kelly NeighborhoodEstimated Value: $569,432 - $771,000
9
Beds
3
Baths
4,158
Sq Ft
$156/Sq Ft
Est. Value
About This Home
This home is located at 133 Osborn St, Fall River, MA 02724 and is currently estimated at $648,858, approximately $156 per square foot. 133 Osborn St is a home located in Bristol County with nearby schools including Carlton M. Viveiros Elementary School, Matthew J. Kuss Middle School, and B M C Durfee High School.
Ownership History
Date
Name
Owned For
Owner Type
Purchase Details
Closed on
May 30, 2006
Sold by
Silva Arthur and Silva Durval
Bought by
Ferreira Richard and Ferreira Sonia F
Current Estimated Value
Home Financials for this Owner
Home Financials are based on the most recent Mortgage that was taken out on this home.
Original Mortgage
$255,900
Interest Rate
6.53%
Mortgage Type
Purchase Money Mortgage
Purchase Details
Closed on
Mar 3, 2004
Sold by
Costa Maria P and Dacosta Maria P
Bought by
Silva Arthur Rem and Silva Durval Rem
Create a Home Valuation Report for This Property
The Home Valuation Report is an in-depth analysis detailing your home's value as well as a comparison with similar homes in the area
Home Values in the Area
Average Home Value in this Area
Purchase History
| Date | Buyer | Sale Price | Title Company |
|---|---|---|---|
| Ferreira Richard | $319,900 | -- | |
| Silva Arthur Rem | -- | -- |
Source: Public Records
Mortgage History
| Date | Status | Borrower | Loan Amount |
|---|---|---|---|
| Open | Silva Arthur Rem | $221,815 | |
| Closed | Ferreira Richard | $255,900 |
Source: Public Records
Tax History
| Year | Tax Paid | Tax Assessment Tax Assessment Total Assessment is a certain percentage of the fair market value that is determined by local assessors to be the total taxable value of land and additions on the property. | Land | Improvement |
|---|---|---|---|---|
| 2025 | $6,256 | $546,400 | $108,600 | $437,800 |
| 2024 | $5,982 | $520,600 | $104,600 | $416,000 |
| 2023 | $5,325 | $434,000 | $86,400 | $347,600 |
| 2022 | $4,707 | $373,000 | $82,300 | $290,700 |
| 2021 | $4,424 | $319,900 | $78,300 | $241,600 |
| 2020 | $3,949 | $273,300 | $77,200 | $196,100 |
| 2019 | $3,339 | $229,000 | $74,300 | $154,700 |
| 2018 | $3,197 | $218,700 | $80,500 | $138,200 |
| 2017 | $3,009 | $214,900 | $76,700 | $138,200 |
| 2016 | $2,947 | $216,200 | $81,600 | $134,600 |
| 2015 | $2,828 | $216,200 | $81,600 | $134,600 |
| 2014 | $2,858 | $227,200 | $79,200 | $148,000 |
Source: Public Records
Map
Nearby Homes
- 70 Brown St
- 1273-1279 S Main St
- 420 Bradford Ave
- 71 Mystic St Unit 3
- 303 Eagle St Unit C
- 82 Montaup St
- 150 Forest St
- 334 Fountain St
- 403 Division St Unit 13
- 403 Division St Unit 5
- 403 Division St Unit 9
- 403 Division St Unit 11
- 403 Division St Unit 12
- 403 Division St Unit 1
- 403 Division St Unit 18
- 1334 S Main St
- 111 Park St
- 105 Park St
- 640 S Main St
- 928 Middle St
- 121 Osborn St
- 121 Osborn St Unit 3F
- 145 Osborn St
- 113 Osborn St
- 22 Florida St
- 22 Florida St Unit 2
- 22 Florida St Unit 1
- 163 Osborn St Unit 165
- 16 Dussault St
- 128 Osborn St
- 122 Osborn St
- 112 Osborn St Unit 3
- 112 Osborn St
- 114 Osborn Unit 3
- 24 Dussault St
- 175 Osborn St Unit 1Rear
- 000 Florida St
- 171 Osborn St
- 171 Osborn St
- 78 Rockland St
Your Personal Tour Guide
Ask me questions while you tour the home.