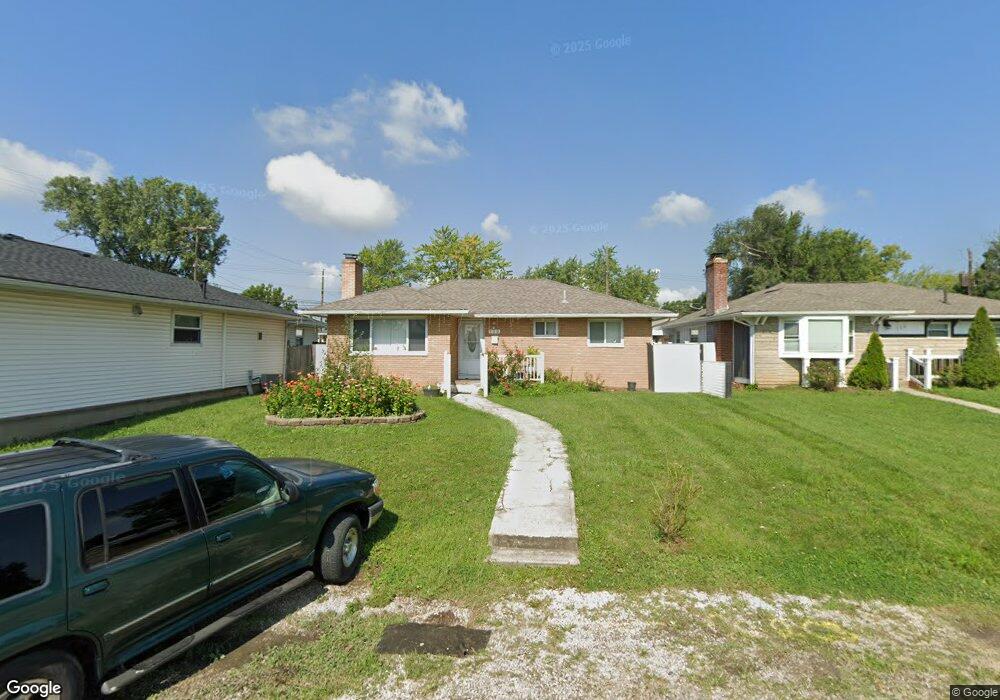
133 Oxley Rd Columbus, OH 43228
Estimated Value: $205,266 - $221,000
4
Beds
1
Bath
1,080
Sq Ft
$198/Sq Ft
Est. Value
About This Home
This home is located at 133 Oxley Rd, Columbus, OH 43228 and is currently estimated at $214,067, approximately $198 per square foot. 133 Oxley Rd is a home located in Franklin County with nearby schools including Prairie Norton Elementary School, Galloway Ridge Intermediate School, and Norton Middle School.
Ownership History
Date
Name
Owned For
Owner Type
Purchase Details
Closed on
Sep 19, 2024
Sold by
Ruber Elfrida and Cespedes Juan R
Bought by
Ruber Elfrida and Cespedes Juan R
Current Estimated Value
Purchase Details
Closed on
Mar 19, 2004
Sold by
Aldridge Angel L
Bought by
Cespedes Juan R and Ruber Elfrida
Home Financials for this Owner
Home Financials are based on the most recent Mortgage that was taken out on this home.
Original Mortgage
$106,900
Interest Rate
5.65%
Mortgage Type
Purchase Money Mortgage
Purchase Details
Closed on
Feb 29, 2000
Sold by
Palmetto Inc
Bought by
Aldridge Angel L and Aldridge Henry
Home Financials for this Owner
Home Financials are based on the most recent Mortgage that was taken out on this home.
Original Mortgage
$70,300
Interest Rate
8.27%
Create a Home Valuation Report for This Property
The Home Valuation Report is an in-depth analysis detailing your home's value as well as a comparison with similar homes in the area
Home Values in the Area
Average Home Value in this Area
Purchase History
| Date | Buyer | Sale Price | Title Company |
|---|---|---|---|
| Ruber Elfrida | -- | None Listed On Document | |
| Cespedes Juan R | $106,900 | Chicago Title | |
| Aldridge Angel L | $72,500 | Franklin Abstract |
Source: Public Records
Mortgage History
| Date | Status | Borrower | Loan Amount |
|---|---|---|---|
| Previous Owner | Cespedes Juan R | $106,900 | |
| Previous Owner | Aldridge Angel L | $70,300 |
Source: Public Records
Tax History Compared to Growth
Tax History
| Year | Tax Paid | Tax Assessment Tax Assessment Total Assessment is a certain percentage of the fair market value that is determined by local assessors to be the total taxable value of land and additions on the property. | Land | Improvement |
|---|---|---|---|---|
| 2024 | $4,171 | $62,030 | $14,180 | $47,850 |
| 2023 | $2,663 | $62,020 | $14,175 | $47,845 |
| 2022 | $1,927 | $31,540 | $2,910 | $28,630 |
| 2021 | $1,959 | $31,540 | $2,910 | $28,630 |
| 2020 | $1,950 | $31,540 | $2,910 | $28,630 |
| 2019 | $1,863 | $26,330 | $2,420 | $23,910 |
| 2018 | $1,805 | $26,330 | $2,420 | $23,910 |
| 2017 | $1,754 | $26,330 | $2,420 | $23,910 |
| 2016 | $1,752 | $23,980 | $4,870 | $19,110 |
| 2015 | $1,752 | $23,980 | $4,870 | $19,110 |
| 2014 | $1,753 | $23,980 | $4,870 | $19,110 |
| 2013 | $1,019 | $28,175 | $5,705 | $22,470 |
Source: Public Records
Map
Nearby Homes
- 40 Gladys Rd
- 264 Woodlawn Ave
- 354 Fernhill Ave
- 435 Redmond Rd
- 429 Postle Blvd
- 4637 Hilton Ave
- 299 Lombard Rd
- 127 Tarryton Ct W Unit 23D
- 110 Pasadena Ave
- 4696 Tarryton Ct S Unit 7-2D
- 141 Beacon Run W Unit 26E
- 74 Tarryton Ct E Unit 10A
- 5006 Old Tree Ave
- 4778 Hafey Ave
- 488 Lombard Rd
- 218 Darbyhurst Rd
- 271 Carilla Ln
- 5409 Longworth Dr
- 4715 Sullivant Ave Unit 46
- 5504 Inglecrest Place