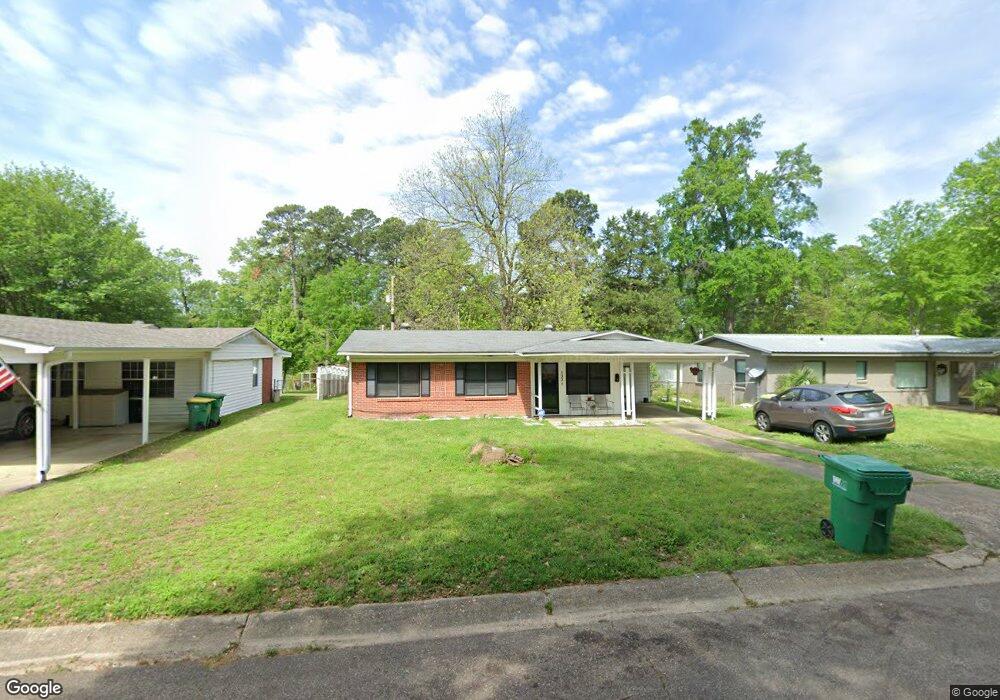
133 Park Cir Texarkana, TX 75503
Estimated Value: $90,586 - $136,000
--
Bed
--
Bath
945
Sq Ft
$114/Sq Ft
Est. Value
About This Home
This home is located at 133 Park Cir, Texarkana, TX 75503 and is currently estimated at $108,147, approximately $114 per square foot. 133 Park Cir is a home located in Bowie County with nearby schools including Spring Lake Park Elementary School, Texas Middle School, and Texas High School.
Ownership History
Date
Name
Owned For
Owner Type
Purchase Details
Closed on
May 26, 2016
Sold by
Red River Employees Fcu
Bought by
Scott Nicole E
Current Estimated Value
Home Financials for this Owner
Home Financials are based on the most recent Mortgage that was taken out on this home.
Original Mortgage
$61,120
Outstanding Balance
$48,545
Interest Rate
3.59%
Mortgage Type
Purchase Money Mortgage
Estimated Equity
$59,603
Purchase Details
Closed on
Jan 19, 2016
Sold by
Tullos Alton Kyle
Bought by
Red River Employees Fcu and Red River Fcu
Purchase Details
Closed on
Jul 19, 2006
Sold by
Johnson Denise
Bought by
Tullos Alton Kyle and Tullos Melissa Leann
Home Financials for this Owner
Home Financials are based on the most recent Mortgage that was taken out on this home.
Original Mortgage
$10,600
Interest Rate
6.66%
Mortgage Type
Unknown
Create a Home Valuation Report for This Property
The Home Valuation Report is an in-depth analysis detailing your home's value as well as a comparison with similar homes in the area
Home Values in the Area
Average Home Value in this Area
Purchase History
| Date | Buyer | Sale Price | Title Company |
|---|---|---|---|
| Scott Nicole E | -- | Twin City Title Company | |
| Red River Employees Fcu | $42,400 | None Available | |
| Tullos Alton Kyle | $53,000 | None Available |
Source: Public Records
Mortgage History
| Date | Status | Borrower | Loan Amount |
|---|---|---|---|
| Open | Scott Nicole E | $61,120 | |
| Previous Owner | Tullos Alton Kyle | $10,600 | |
| Previous Owner | Tullos Alton Kyle | $42,400 |
Source: Public Records
Tax History Compared to Growth
Tax History
| Year | Tax Paid | Tax Assessment Tax Assessment Total Assessment is a certain percentage of the fair market value that is determined by local assessors to be the total taxable value of land and additions on the property. | Land | Improvement |
|---|---|---|---|---|
| 2025 | $913 | $88,681 | $8,500 | $80,181 |
| 2024 | $913 | $84,619 | $8,500 | $77,878 |
| 2023 | $1,822 | $76,926 | $0 | $0 |
| 2022 | $1,669 | $73,643 | $8,500 | $65,143 |
| 2021 | $1,626 | $63,575 | $8,500 | $55,075 |
| 2020 | $1,569 | $61,022 | $8,500 | $52,522 |
| 2019 | $1,563 | $58,589 | $8,500 | $50,089 |
| 2018 | $1,513 | $56,715 | $8,500 | $48,215 |
| 2017 | $1,484 | $55,801 | $8,500 | $47,301 |
| 2016 | $1,478 | $55,561 | $8,500 | $47,061 |
| 2015 | $1,320 | $55,112 | $8,500 | $46,612 |
| 2014 | $1,320 | $60,999 | $8,500 | $52,499 |
Source: Public Records
Map
Nearby Homes