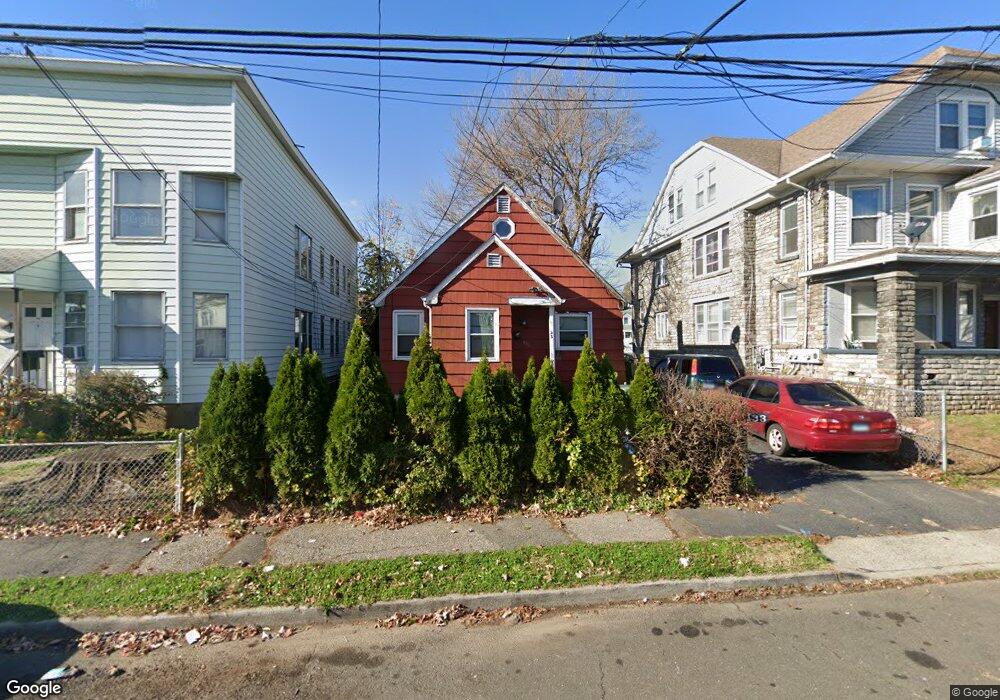
133 Pixlee Place Bridgeport, CT 06610
Boston Ave-Mill Hill NeighborhoodEstimated Value: $191,000 - $386,285
4
Beds
2
Baths
1,108
Sq Ft
$289/Sq Ft
Est. Value
About This Home
This home is located at 133 Pixlee Place, Bridgeport, CT 06610 and is currently estimated at $320,571, approximately $289 per square foot. 133 Pixlee Place is a home located in Fairfield County with nearby schools including Hall School, Harding High School, and Achievement First Bridgeport Academy Elementary School.
Ownership History
Date
Name
Owned For
Owner Type
Purchase Details
Closed on
Dec 12, 2024
Sold by
Dennis Sherri
Bought by
133 Pixlee Pi Llc
Current Estimated Value
Home Financials for this Owner
Home Financials are based on the most recent Mortgage that was taken out on this home.
Original Mortgage
$178,000
Outstanding Balance
$176,279
Interest Rate
6.79%
Mortgage Type
Purchase Money Mortgage
Estimated Equity
$144,292
Purchase Details
Closed on
Aug 27, 2013
Sold by
Williams Jean
Bought by
Williams Jean
Home Financials for this Owner
Home Financials are based on the most recent Mortgage that was taken out on this home.
Original Mortgage
$157,500
Interest Rate
4.51%
Mortgage Type
New Conventional
Purchase Details
Closed on
Aug 6, 2004
Sold by
Melendez Salomon and Oliva Margarita
Bought by
Wiliams Jean
Purchase Details
Closed on
Oct 31, 2000
Sold by
Bilisko Lorine H
Bought by
Melendez Salomon and Oliva Margarita
Create a Home Valuation Report for This Property
The Home Valuation Report is an in-depth analysis detailing your home's value as well as a comparison with similar homes in the area
Home Values in the Area
Average Home Value in this Area
Purchase History
| Date | Buyer | Sale Price | Title Company |
|---|---|---|---|
| 133 Pixlee Pi Llc | $190,000 | None Available | |
| 133 Pixlee Pi Llc | $190,000 | None Available | |
| 133 Pixlee Pi Llc | $190,000 | None Available | |
| Williams Jean | -- | -- | |
| Wiliams Jean | $166,000 | -- | |
| Melendez Salomon | $105,000 | -- | |
| Williams Jean | -- | -- | |
| Wiliams Jean | $166,000 | -- | |
| Melendez Salomon | $105,000 | -- |
Source: Public Records
Mortgage History
| Date | Status | Borrower | Loan Amount |
|---|---|---|---|
| Open | 133 Pixlee Pi Llc | $178,000 | |
| Closed | 133 Pixlee Pi Llc | $178,000 | |
| Previous Owner | Melendez Salomon | $157,500 |
Source: Public Records
Tax History Compared to Growth
Tax History
| Year | Tax Paid | Tax Assessment Tax Assessment Total Assessment is a certain percentage of the fair market value that is determined by local assessors to be the total taxable value of land and additions on the property. | Land | Improvement |
|---|---|---|---|---|
| 2025 | $5,424 | $124,830 | $54,100 | $70,730 |
| 2024 | $5,424 | $124,830 | $54,100 | $70,730 |
| 2023 | $5,424 | $124,830 | $54,100 | $70,730 |
| 2022 | $5,424 | $124,830 | $54,100 | $70,730 |
| 2021 | $5,424 | $124,830 | $54,100 | $70,730 |
| 2020 | $4,362 | $80,790 | $21,390 | $59,400 |
| 2019 | $4,362 | $80,790 | $21,390 | $59,400 |
| 2018 | $4,393 | $80,790 | $21,390 | $59,400 |
| 2017 | $4,393 | $80,790 | $21,390 | $59,400 |
| 2016 | $4,393 | $80,790 | $21,390 | $59,400 |
| 2015 | $4,822 | $114,270 | $30,190 | $84,080 |
| 2014 | $4,822 | $114,270 | $30,190 | $84,080 |
Source: Public Records
Map
Nearby Homes
- 73 Pixlee Place
- 215 Summerfield Ave
- 123 Summerfield Ave
- 123-125 Summerfield Ave
- 400 East Ave
- 270 East Ave
- 652 Bishop Ave Unit 656
- 35 Kent Ave
- 1922 Boston Ave Unit 1924
- 1804 Barnum Ave
- 1575 Boston Ave Unit B2
- 69 Weber Ave
- 102 Bowe Ave
- 415 Bruce Ave
- 266 Peace St
- 3 Granfield Ave
- 357 Granfield Ave Unit B
- 401 Granfield Ave Unit 2
- 361 Granfield Ave Unit Bldg 8, A
- 260 Success Ave Unit 21
- 125 Pixlee Place Unit 2nd fl
- 123 Pixlee Place
- 141 Pixlee Place
- 149 Pixlee Place
- 115 Pixlee Place
- 151 Pixlee Place
- 172 Prince St
- 136 Pixlee Place
- 170 Prince St
- 114 Pixlee Place
- 109 Pixlee Place
- 158 Pixlee Place Unit 160
- 198 Prince St Unit 3
- 198 Prince St Unit 1
- 162 Prince St
- 128 Prince St Unit 3rd. Fl.
- 196 Prince St Unit 2
- 196 Prince St Unit 3
- 128 Prince St Unit 3rd.
- 128 Prince St