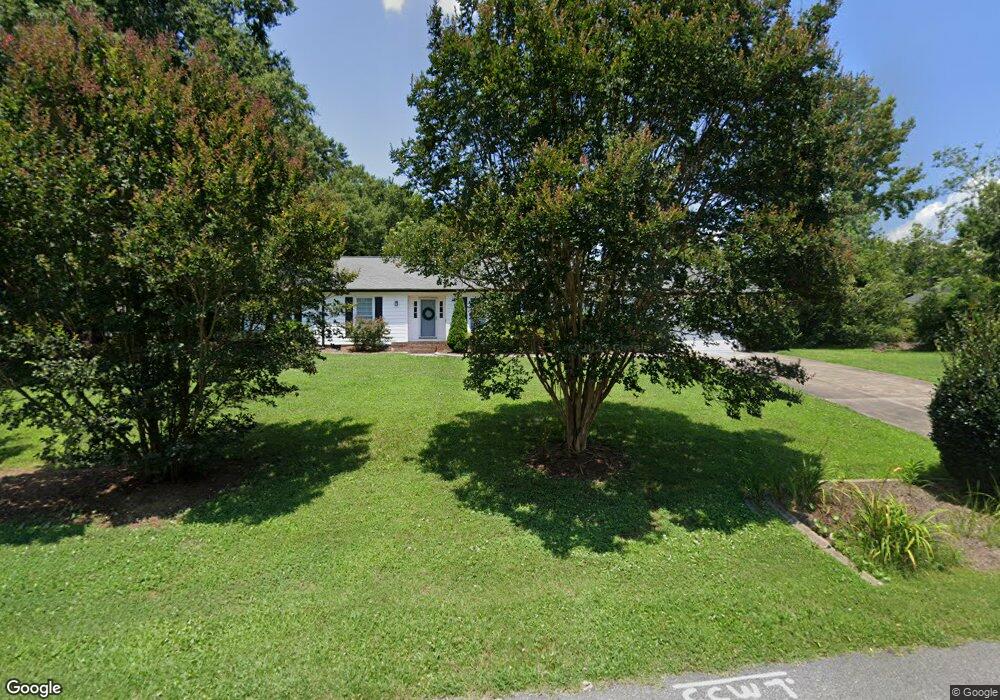
133 Quail Hollow Dr Kings Mountain, NC 28086
Estimated Value: $392,131 - $445,000
3
Beds
2
Baths
1,960
Sq Ft
$210/Sq Ft
Est. Value
About This Home
This home is located at 133 Quail Hollow Dr, Kings Mountain, NC 28086 and is currently estimated at $412,283, approximately $210 per square foot. 133 Quail Hollow Dr is a home located in Cleveland County with nearby schools including Washington Elementary School, Burns Middle, and Burns High School.
Ownership History
Date
Name
Owned For
Owner Type
Purchase Details
Closed on
Apr 18, 2019
Sold by
Bonin West James Kevin and Bonin West Tabitha
Bought by
Harmon Christian and Harmon Sara
Current Estimated Value
Home Financials for this Owner
Home Financials are based on the most recent Mortgage that was taken out on this home.
Original Mortgage
$201,000
Outstanding Balance
$178,693
Interest Rate
4.87%
Mortgage Type
Adjustable Rate Mortgage/ARM
Estimated Equity
$233,590
Purchase Details
Closed on
Mar 3, 2017
Sold by
Ford Darryl K and Ford Linda M Duffin
Bought by
West James Kevin and West Tabitha Bonin
Home Financials for this Owner
Home Financials are based on the most recent Mortgage that was taken out on this home.
Original Mortgage
$181,649
Interest Rate
4.5%
Mortgage Type
FHA
Purchase Details
Closed on
Dec 11, 2012
Sold by
Mclain Brenda S and Graham Zachary Dean
Bought by
Ford Darryl K and Ford Linda M Duffin
Home Financials for this Owner
Home Financials are based on the most recent Mortgage that was taken out on this home.
Original Mortgage
$122,075
Interest Rate
3.45%
Mortgage Type
New Conventional
Create a Home Valuation Report for This Property
The Home Valuation Report is an in-depth analysis detailing your home's value as well as a comparison with similar homes in the area
Home Values in the Area
Average Home Value in this Area
Purchase History
| Date | Buyer | Sale Price | Title Company |
|---|---|---|---|
| Harmon Christian | $200,000 | None Available | |
| West James Kevin | $185,000 | None Available | |
| Ford Darryl K | $129,000 | None Available |
Source: Public Records
Mortgage History
| Date | Status | Borrower | Loan Amount |
|---|---|---|---|
| Open | Harmon Christian | $201,000 | |
| Previous Owner | West James Kevin | $181,649 | |
| Previous Owner | West James Kevin | $5,499 | |
| Previous Owner | Ford Darryl K | $122,075 |
Source: Public Records
Tax History Compared to Growth
Tax History
| Year | Tax Paid | Tax Assessment Tax Assessment Total Assessment is a certain percentage of the fair market value that is determined by local assessors to be the total taxable value of land and additions on the property. | Land | Improvement |
|---|---|---|---|---|
| 2025 | $2,246 | $353,727 | $40,556 | $313,171 |
| 2024 | $1,759 | $218,060 | $36,230 | $181,830 |
| 2023 | $1,750 | $218,060 | $36,230 | $181,830 |
| 2022 | $1,750 | $218,060 | $36,230 | $181,830 |
| 2021 | $1,759 | $218,060 | $36,230 | $181,830 |
| 2020 | $1,380 | $164,073 | $36,230 | $127,843 |
| 2019 | $1,431 | $164,073 | $36,230 | $127,843 |
| 2018 | $1,427 | $164,073 | $36,230 | $127,843 |
| 2017 | $1,420 | $164,073 | $36,230 | $127,843 |
| 2016 | $1,315 | $164,073 | $36,230 | $127,843 |
| 2015 | $1,420 | $177,372 | $31,543 | $145,829 |
| 2014 | $1,420 | $177,372 | $31,543 | $145,829 |
Source: Public Records
Map
Nearby Homes
- 107 Pinelake Dr
- 160 Quail Hollow Dr
- 107 Muirfield Dr
- 102 Starmount Dr
- 3005 Vernell Ln
- 108 Three Oaks Ln
- 106 Candlewood Dr
- 2207 Peninsula Ave
- 956 Stony Point Rd
- 2200 Peninsula Ave
- 2201 Holly Ln
- 00 Bottom Rd Unit 1
- 00 Bottom Rd Unit 2
- 122 Bottom Rd
- 111 Bottom Rd
- 2016 Dogwood Trail
- 2021 Dogwood Trail
- 110 Cypress Point Dr
- 116 Cypress Point Dr
- 111 Tarheel Dr
- 111 Quail Hollow Dr
- 125 Quail Hollow Dr
- 135 Quail Hollow Dr
- 0 Quail Hollow Dr
- 109 Quail Hollow Dr
- 105 Quail Hollow Dr
- 132 Quail Hollow Dr
- 113 Quail Hollow Dr
- 134 Quail Hollow Dr
- 130 Quail Hollow Dr
- 128 Quail Hollow Dr
- 112 Quail Hollow Dr
- 107 Quail Hollow Dr
- 138 Quail Hollow Dr
- 126 Quail Hollow Dr
- 122 Quail Hollow Dr
- 104 Quail Hollow Dr
- 114 Quail Hollow Dr
- 142 Quail Hollow Dr
- 139 Quail Hollow Dr