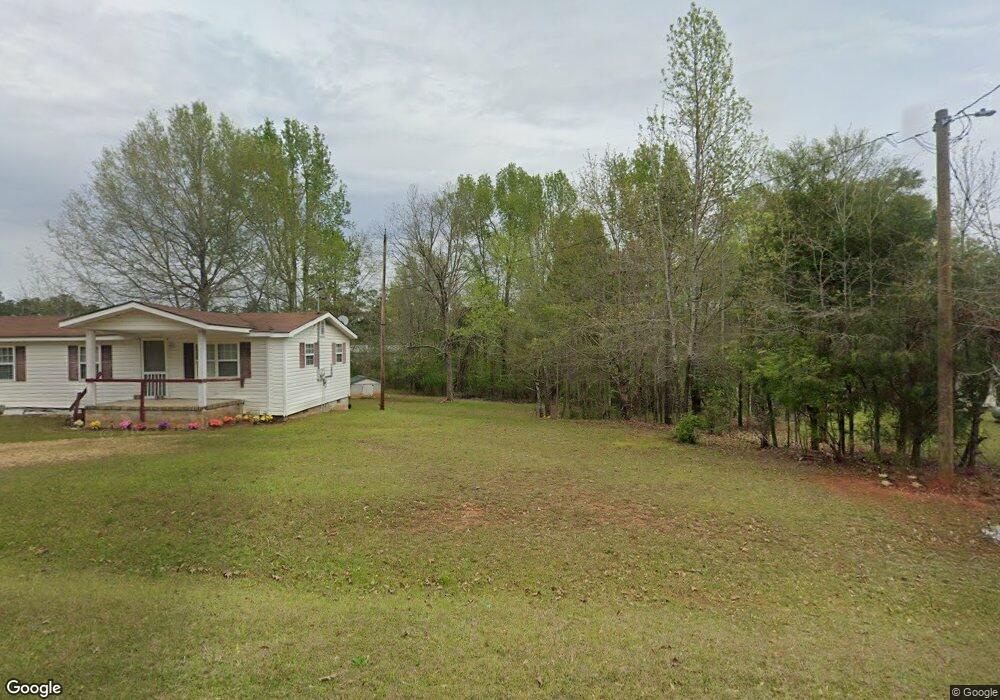
133 Roberts Rd NW Haddock, GA 31033
Estimated Value: $125,000 - $173,000
3
Beds
2
Baths
1,000
Sq Ft
$153/Sq Ft
Est. Value
About This Home
This home is located at 133 Roberts Rd NW, Haddock, GA 31033 and is currently estimated at $153,448, approximately $153 per square foot. 133 Roberts Rd NW is a home located in Baldwin County with nearby schools including Midway Hills Primary School, Midway Hills Academy, and Oak Hill Middle School.
Ownership History
Date
Name
Owned For
Owner Type
Purchase Details
Closed on
Dec 8, 2011
Sold by
Southern Specialty Properties Llc
Bought by
Williams Bernadine
Current Estimated Value
Purchase Details
Closed on
Oct 21, 2011
Sold by
Secretary Of Housing & Urban Development
Bought by
Southern Specialty Properties Llc
Purchase Details
Closed on
Jul 6, 2010
Sold by
Wells Fargo Bank Na
Bought by
Secretary Of Housing & Urban Development
Purchase Details
Closed on
Jul 28, 2008
Sold by
Colter George Allix
Bought by
Smith Ashley P and Smith Shawn A
Purchase Details
Closed on
May 23, 2007
Sold by
Earthworks Construction Ll
Bought by
Colter George Allix and Clements Robert B
Purchase Details
Closed on
Jun 29, 2005
Sold by
Colter George Allix
Bought by
Earth Works Construction Llc
Purchase Details
Closed on
Mar 16, 2005
Sold by
Citifinancial Svcs Inc
Bought by
Clements John B and Colter George Allix
Purchase Details
Closed on
Jan 4, 2005
Sold by
Freeman Margaret C
Bought by
Citifinancial Services Inc
Create a Home Valuation Report for This Property
The Home Valuation Report is an in-depth analysis detailing your home's value as well as a comparison with similar homes in the area
Home Values in the Area
Average Home Value in this Area
Purchase History
| Date | Buyer | Sale Price | Title Company |
|---|---|---|---|
| Williams Bernadine | $22,000 | -- | |
| Southern Specialty Properties Llc | $12,900 | -- | |
| Secretary Of Housing & Urban Development | $84,000 | -- | |
| Wells Fargo Bank Na | $83,991 | -- | |
| Smith Ashley P | $76,200 | -- | |
| Colter George Allix | -- | -- | |
| Earth Works Construction Llc | -- | -- | |
| Clements John B | $13,500 | -- | |
| Citifinancial Services Inc | $20,200 | -- |
Source: Public Records
Tax History Compared to Growth
Tax History
| Year | Tax Paid | Tax Assessment Tax Assessment Total Assessment is a certain percentage of the fair market value that is determined by local assessors to be the total taxable value of land and additions on the property. | Land | Improvement |
|---|---|---|---|---|
| 2025 | $994 | $40,804 | $4,896 | $35,908 |
| 2024 | $994 | $40,804 | $4,896 | $35,908 |
| 2023 | $82 | $30,332 | $4,080 | $26,252 |
| 2022 | $535 | $30,920 | $4,080 | $26,840 |
| 2021 | $313 | $21,160 | $4,080 | $17,080 |
| 2020 | $309 | $21,160 | $4,080 | $17,080 |
| 2019 | $309 | $21,160 | $4,080 | $17,080 |
| 2018 | $317 | $21,160 | $4,080 | $17,080 |
| 2017 | $285 | $21,160 | $4,080 | $17,080 |
| 2016 | $425 | $25,800 | $4,680 | $21,120 |
| 2015 | $426 | $25,800 | $4,680 | $21,120 |
| 2014 | $427 | $25,800 | $4,680 | $21,120 |
Source: Public Records
Map
Nearby Homes
- 119 Hough Johnson Rd
- 872 W Hwy 49
- 645-D W Hwy 22
- 8 State Route 49w
- 312 State Route 49w
- 251 Pettigrew Rd NW
- 0 Pettigrew Rd NW
- 190 Weaver Rd
- 111 Woodland Hills Lake Ln
- 101 22 E Hwy
- 465 Smith Rd
- 143 McCullar Weaver Rd SW
- 34 Ash St
- 315 Nelson Rd NW
- 116 N Oak St
- 1370 Georgia 22
- 1370 Ga Highway 22 E
- 216 Georgia 22
- 386 Nelson Rd NW
- 205 22 W Hwy
- 133 Roberts Rd NW
- 139 Roberts Rd NW
- 125 Roberts Rd NW
- 128 Roberts Rd NW
- 136 Roberts Rd NW
- 290 Browns Crossing Rd NW
- 124 Roberts Rd NW
- 232 Browns Crossing Rd NW
- 226 Browns Crossing Rd NW
- 138 Roberts Rd NW
- 213 Browns Crossing Rd NW Unit 4 & 5
- 213 Browns Crossing Rd NW
- 185 Browns Crossing Rd NW
- 196 Roberts Rd NW
- 134 Johnson Hough Rd NW
- 128 Johnson Hough Rd NW
- 318 Browns Crossing Rd NW
- 112 Johnson Hough Rd NW
- 104 Hough Johnson Rd
- 204 Roberts Rd NW