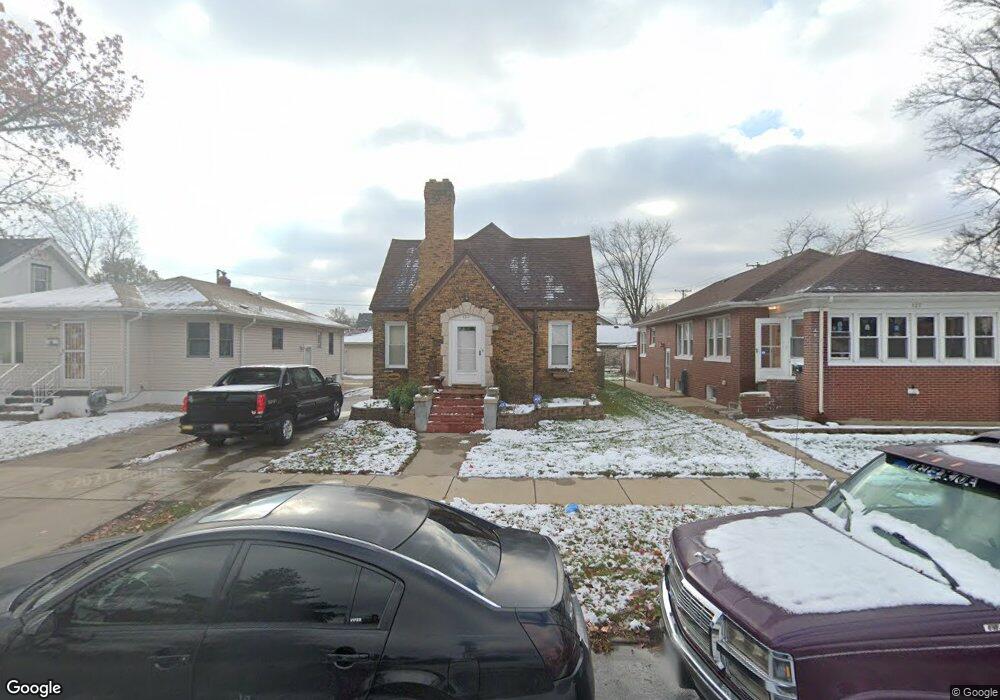
133 Ruth St Calumet City, IL 60409
Estimated Value: $130,000 - $190,000
2
Beds
1
Bath
786
Sq Ft
$196/Sq Ft
Est. Value
About This Home
This home is located at 133 Ruth St, Calumet City, IL 60409 and is currently estimated at $154,082, approximately $196 per square foot. 133 Ruth St is a home located in Cook County with nearby schools including Lincoln Elementary School, Thornton Fractional North High School, and Hammond Academy Of Science & Tech.
Ownership History
Date
Name
Owned For
Owner Type
Purchase Details
Closed on
Apr 13, 2004
Sold by
Pompa Micaela
Bought by
Pompa Micaela and Pompa Javier
Current Estimated Value
Purchase Details
Closed on
Mar 7, 2003
Sold by
Kotsiovos Christos
Bought by
Pompa Micaela
Home Financials for this Owner
Home Financials are based on the most recent Mortgage that was taken out on this home.
Original Mortgage
$84,550
Outstanding Balance
$39,300
Interest Rate
7%
Estimated Equity
$114,782
Purchase Details
Closed on
Mar 12, 2001
Sold by
Federal National Mortgage Association
Bought by
Kotsiovos Christos P
Home Financials for this Owner
Home Financials are based on the most recent Mortgage that was taken out on this home.
Original Mortgage
$51,500
Interest Rate
7.02%
Purchase Details
Closed on
Oct 3, 2000
Sold by
Voltattorni Frank J
Bought by
Federal National Mortgage Association
Create a Home Valuation Report for This Property
The Home Valuation Report is an in-depth analysis detailing your home's value as well as a comparison with similar homes in the area
Home Values in the Area
Average Home Value in this Area
Purchase History
| Date | Buyer | Sale Price | Title Company |
|---|---|---|---|
| Pompa Micaela | -- | -- | |
| Pompa Micaela | -- | -- | |
| Kotsiovos Christos P | -- | -- | |
| Federal National Mortgage Association | -- | -- |
Source: Public Records
Mortgage History
| Date | Status | Borrower | Loan Amount |
|---|---|---|---|
| Open | Pompa Micaela | $84,550 | |
| Previous Owner | Kotsiovos Christos P | $51,500 |
Source: Public Records
Tax History Compared to Growth
Tax History
| Year | Tax Paid | Tax Assessment Tax Assessment Total Assessment is a certain percentage of the fair market value that is determined by local assessors to be the total taxable value of land and additions on the property. | Land | Improvement |
|---|---|---|---|---|
| 2024 | $4,250 | $11,000 | $1,904 | $9,096 |
| 2023 | $2,087 | $11,000 | $1,904 | $9,096 |
| 2022 | $2,087 | $6,304 | $1,666 | $4,638 |
| 2021 | $2,196 | $6,303 | $1,666 | $4,637 |
| 2020 | $2,834 | $7,216 | $1,666 | $5,550 |
| 2019 | $2,201 | $6,473 | $1,547 | $4,926 |
| 2018 | $2,165 | $6,473 | $1,547 | $4,926 |
| 2017 | $2,127 | $6,473 | $1,547 | $4,926 |
| 2016 | $2,547 | $6,436 | $1,428 | $5,008 |
| 2015 | $2,380 | $6,436 | $1,428 | $5,008 |
| 2014 | $2,412 | $6,436 | $1,428 | $5,008 |
| 2013 | $2,746 | $7,477 | $1,428 | $6,049 |
Source: Public Records
Map
Nearby Homes