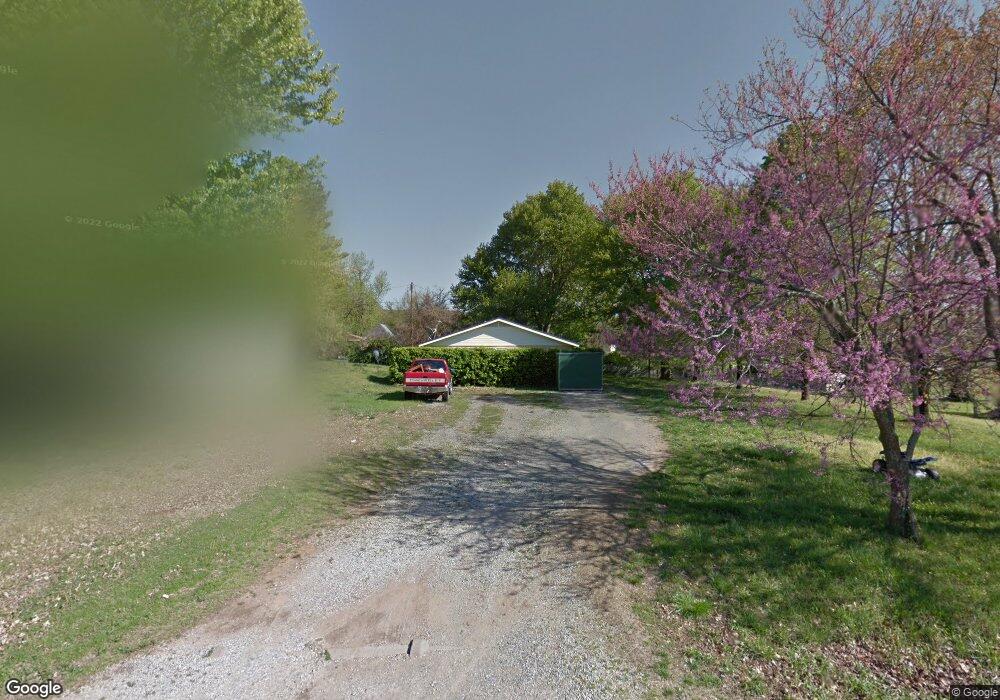
133 Ruth St Farmington, AR 72730
Estimated Value: $167,933 - $336,000
Studio
2
Baths
1,664
Sq Ft
$166/Sq Ft
Est. Value
About This Home
This home is located at 133 Ruth St, Farmington, AR 72730 and is currently estimated at $276,733, approximately $166 per square foot. 133 Ruth St is a home located in Washington County with nearby schools including Jerry Pop Williams Elementary School, Randall G. Lynch Middle School, and Farmington Jr. High.
Ownership History
Date
Name
Owned For
Owner Type
Purchase Details
Closed on
Dec 22, 2006
Sold by
Mcdougall Douglas and Mcdougall Jeanne
Bought by
Dinh
Current Estimated Value
Home Financials for this Owner
Home Financials are based on the most recent Mortgage that was taken out on this home.
Original Mortgage
$109,038
Outstanding Balance
$64,714
Interest Rate
6.27%
Mortgage Type
Purchase Money Mortgage
Estimated Equity
$212,019
Purchase Details
Closed on
Apr 14, 2006
Sold by
Havens Joan I
Bought by
Mcdougall Douglas
Home Financials for this Owner
Home Financials are based on the most recent Mortgage that was taken out on this home.
Original Mortgage
$72,933
Interest Rate
6.22%
Mortgage Type
Purchase Money Mortgage
Purchase Details
Closed on
Jan 6, 2006
Sold by
Havens William R and Havens Joan I
Bought by
Havens Joan I and William R Havens Trust
Purchase Details
Closed on
Jan 1, 1985
Bought by
Havens William R and Maren Lee
Create a Home Valuation Report for This Property
The Home Valuation Report is an in-depth analysis detailing your home's value as well as a comparison with similar homes in the area
Home Values in the Area
Average Home Value in this Area
Purchase History
| Date | Buyer | Sale Price | Title Company |
|---|---|---|---|
| Dinh | $110,000 | Lenders Title Company | |
| Mcdougall Douglas | $91,000 | Lenders | |
| Havens Joan I | -- | None Available | |
| Havens William R | -- | -- |
Source: Public Records
Mortgage History
| Date | Status | Borrower | Loan Amount |
|---|---|---|---|
| Open | Dinh | $109,038 | |
| Previous Owner | Mcdougall Douglas | $72,933 |
Source: Public Records
Tax History
| Year | Tax Paid | Tax Assessment Tax Assessment Total Assessment is a certain percentage of the fair market value that is determined by local assessors to be the total taxable value of land and additions on the property. | Land | Improvement |
|---|---|---|---|---|
| 2025 | $558 | $30,540 | $8,400 | $22,140 |
| 2024 | $605 | $30,540 | $8,400 | $22,140 |
| 2023 | $659 | $30,540 | $8,400 | $22,140 |
| 2022 | $642 | $20,020 | $6,000 | $14,020 |
| 2021 | $592 | $20,020 | $6,000 | $14,020 |
| 2020 | $537 | $20,020 | $6,000 | $14,020 |
| 2019 | $484 | $15,880 | $6,000 | $9,880 |
| 2018 | $509 | $15,880 | $6,000 | $9,880 |
| 2017 | $501 | $15,880 | $6,000 | $9,880 |
| 2016 | $501 | $15,880 | $6,000 | $9,880 |
| 2015 | $499 | $15,880 | $6,000 | $9,880 |
| 2014 | $451 | $14,940 | $6,000 | $8,940 |
Source: Public Records
Map
Nearby Homes
- 215 N Broyles St
- 199 Ruth St
- 142 N Sheep Dog Ave
- TBD White St
- 15 N Banner Ave
- 27 N Banner Ave
- 39 N Banner Ave
- 76 Watson Ln
- 41 W Ozark Trail
- 110 N Banner Ave
- 82 Watson Ln
- 87 N Banner Ave
- 86 Watson Ln
- 567 Colorado St
- 579 Colorado St
- 400 W Snow Bend
- 4550 W Ozark Trail
- 75 W Pitts St
- 158 N Banner Ave
- 90 Watson Ln
Your Personal Tour Guide
Ask me questions while you tour the home.