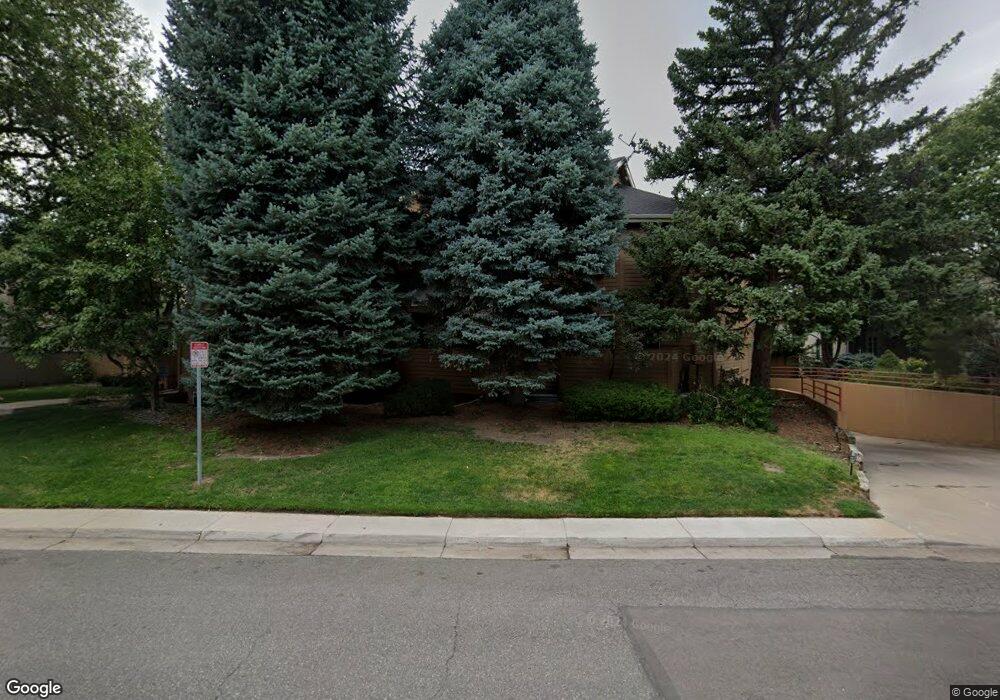
133 S Jackson St Unit A6 Denver, CO 80209
Cherry Creek NeighborhoodEstimated Value: $402,000 - $426,000
1
Bed
2
Baths
865
Sq Ft
$480/Sq Ft
Est. Value
About This Home
This home is located at 133 S Jackson St Unit A6, Denver, CO 80209 and is currently estimated at $414,952, approximately $479 per square foot. 133 S Jackson St Unit A6 is a home located in Denver County with nearby schools including Steck Elementary School, Hill Campus of Arts & Sciences, and George Washington High School.
Ownership History
Date
Name
Owned For
Owner Type
Purchase Details
Closed on
Sep 28, 2000
Sold by
Anne C Johnston Richard B
Bought by
Sparks Christine L
Current Estimated Value
Home Financials for this Owner
Home Financials are based on the most recent Mortgage that was taken out on this home.
Original Mortgage
$131,120
Outstanding Balance
$47,989
Interest Rate
7.97%
Estimated Equity
$366,963
Purchase Details
Closed on
Feb 26, 1999
Sold by
Hankey Howard W
Bought by
Johnston Richard B and Johnston Mary Anne C
Home Financials for this Owner
Home Financials are based on the most recent Mortgage that was taken out on this home.
Original Mortgage
$100,000
Interest Rate
6.83%
Purchase Details
Closed on
Dec 29, 1995
Sold by
Mohr Jannae A
Bought by
Hankey Howard W
Home Financials for this Owner
Home Financials are based on the most recent Mortgage that was taken out on this home.
Original Mortgage
$102,750
Interest Rate
7.31%
Mortgage Type
FHA
Create a Home Valuation Report for This Property
The Home Valuation Report is an in-depth analysis detailing your home's value as well as a comparison with similar homes in the area
Home Values in the Area
Average Home Value in this Area
Purchase History
| Date | Buyer | Sale Price | Title Company |
|---|---|---|---|
| Sparks Christine L | $163,900 | North American Title Co | |
| Johnston Richard B | $139,950 | -- | |
| Hankey Howard W | $106,000 | -- |
Source: Public Records
Mortgage History
| Date | Status | Borrower | Loan Amount |
|---|---|---|---|
| Open | Sparks Christine L | $131,120 | |
| Previous Owner | Johnston Richard B | $100,000 | |
| Previous Owner | Hankey Howard W | $102,750 |
Source: Public Records
Tax History Compared to Growth
Tax History
| Year | Tax Paid | Tax Assessment Tax Assessment Total Assessment is a certain percentage of the fair market value that is determined by local assessors to be the total taxable value of land and additions on the property. | Land | Improvement |
|---|---|---|---|---|
| 2024 | $2,076 | $26,210 | $7,080 | $19,130 |
| 2023 | $2,031 | $26,210 | $7,080 | $19,130 |
| 2022 | $1,917 | $24,100 | $9,670 | $14,430 |
| 2021 | $1,850 | $24,790 | $9,950 | $14,840 |
| 2020 | $1,764 | $23,780 | $9,190 | $14,590 |
| 2019 | $1,715 | $23,780 | $9,190 | $14,590 |
| 2018 | $1,779 | $22,990 | $7,290 | $15,700 |
| 2017 | $1,773 | $22,990 | $7,290 | $15,700 |
| 2016 | $1,760 | $21,580 | $7,665 | $13,915 |
| 2015 | $1,686 | $21,580 | $7,665 | $13,915 |
| 2014 | $1,615 | $19,450 | $5,166 | $14,284 |
Source: Public Records
Map
Nearby Homes
- 133 S Jackson St Unit A7
- 163 S Harrison St
- 21 S Jackson St
- 217 S Jackson St Unit H
- 275 S Harrison St Unit 602
- 111 S Monroe St Unit 303
- 253 S Jackson St
- 150 S Madison St Unit 109
- 150 S Madison St Unit 108
- 150 S Madison St Unit 112
- 267 S Jackson St
- 79 S Albion St
- 14 S Madison St
- 45 Jackson St Unit D
- 41 Harrison St
- 11 Monroe St Unit 103
- 274 S Monroe St Unit 3000/3A
- 77 S Ash St
- 42 S Ash St
- 1 Ash St
- 133 S Jackson St Unit A12
- 133 S Jackson St Unit A11
- 133 S Jackson St Unit A10
- 133 S Jackson St Unit A9
- 133 S Jackson St Unit A8
- 133 S Jackson St Unit A5
- 133 S Jackson St Unit A4
- 133 S Jackson St Unit A3
- 133 S Jackson St Unit A2
- 133 S Jackson St Unit A1
- 133 S Jackson St
- 133 S Jackson St
- 133 S Jackson St Unit 7
- 133 S Jackson St Unit 4
- 133 S Jackson St Unit AA-4
- 149 S Jackson St
- 155 S Jackson St Unit G
- 155 S Jackson St Unit F
- 155 S Jackson St Unit E
- 155 S Jackson St Unit D