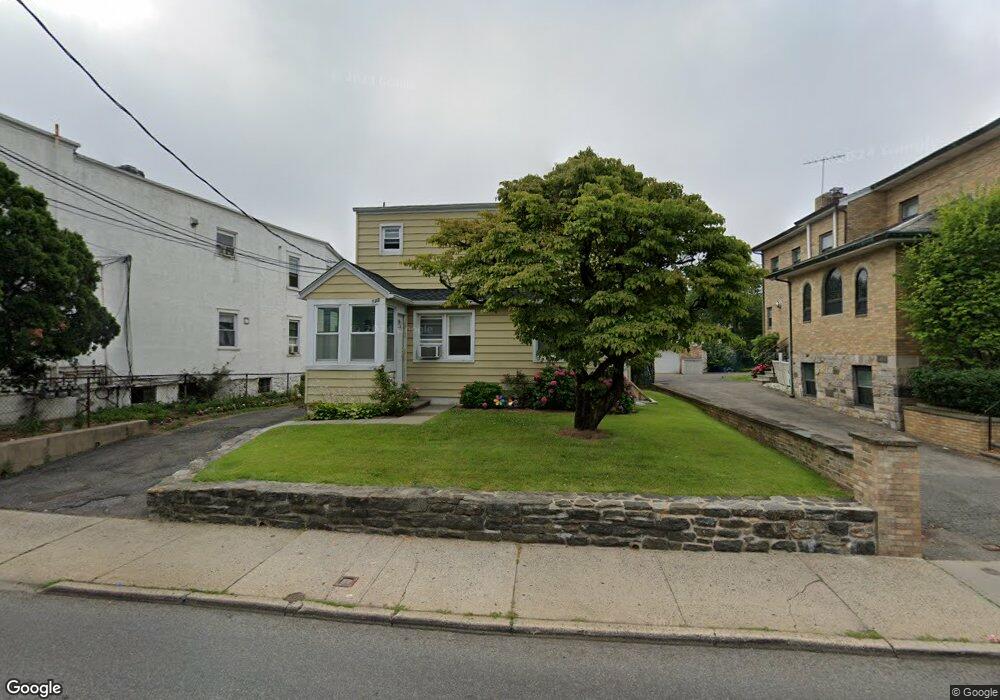
133 S Regent St Unit 1 Port Chester, NY 10573
Estimated Value: $623,000 - $669,000
3
Beds
3
Baths
1,248
Sq Ft
$524/Sq Ft
Est. Value
About This Home
This home is located at 133 S Regent St Unit 1, Port Chester, NY 10573 and is currently estimated at $653,546, approximately $523 per square foot. 133 S Regent St Unit 1 is a home located in Westchester County with nearby schools including Port Chester Senior High School, Corpus Christi Holy Rosary School, and Rye Country Day School.
Ownership History
Date
Name
Owned For
Owner Type
Purchase Details
Closed on
Apr 6, 2023
Sold by
Glielmi Caterina
Bought by
Brito Favian and Britio Evelyn J
Current Estimated Value
Home Financials for this Owner
Home Financials are based on the most recent Mortgage that was taken out on this home.
Original Mortgage
$492,978
Outstanding Balance
$479,024
Interest Rate
6.5%
Mortgage Type
FHA
Estimated Equity
$174,522
Purchase Details
Closed on
Oct 20, 2010
Sold by
Deutsche Bank National Trust Company
Bought by
Glielmi Caterina and Glielmi Franco
Purchase Details
Closed on
Jun 9, 2005
Sold by
Desimone Susan L and Desimone Robert
Bought by
Glenn James
Purchase Details
Closed on
Nov 4, 1999
Sold by
Desimone Susan L and Desimone Louis
Bought by
Desimone Susan L
Create a Home Valuation Report for This Property
The Home Valuation Report is an in-depth analysis detailing your home's value as well as a comparison with similar homes in the area
Home Values in the Area
Average Home Value in this Area
Purchase History
| Date | Buyer | Sale Price | Title Company |
|---|---|---|---|
| Brito Favian | $530,000 | First American Title | |
| Glielmi Caterina | $240,000 | Castle Title Ins Agency Inc | |
| Glenn James | $458,250 | New York Title Research | |
| Desimone Susan L | -- | -- |
Source: Public Records
Mortgage History
| Date | Status | Borrower | Loan Amount |
|---|---|---|---|
| Open | Brito Favian | $492,978 |
Source: Public Records
Tax History Compared to Growth
Tax History
| Year | Tax Paid | Tax Assessment Tax Assessment Total Assessment is a certain percentage of the fair market value that is determined by local assessors to be the total taxable value of land and additions on the property. | Land | Improvement |
|---|---|---|---|---|
| 2024 | $12,020 | $525,500 | $197,100 | $328,400 |
| 2023 | $11,407 | $495,800 | $187,800 | $308,000 |
| 2022 | $10,536 | $476,700 | $187,800 | $288,900 |
| 2021 | $11,418 | $429,500 | $187,800 | $241,700 |
| 2020 | $9,734 | $429,500 | $187,800 | $241,700 |
| 2019 | $13,222 | $334,000 | $140,000 | $194,000 |
| 2018 | $6,751 | $331,300 | $137,600 | $193,700 |
| 2017 | $1,485 | $326,400 | $129,000 | $197,400 |
| 2016 | $12,683 | $337,200 | $129,800 | $207,400 |
| 2015 | -- | $305,700 | $105,300 | $200,400 |
| 2014 | -- | $300,300 | $95,500 | $204,800 |
| 2013 | -- | $323,300 | $111,400 | $211,900 |
Source: Public Records
Map
Nearby Homes
- 130 Spring St
- 114 Washington St
- 24 Park Place
- 360 Westchester Ave Unit 302
- 360 Westchester Ave Unit 223
- 111 Washington St
- 370 Westchester Ave Unit 7P
- 494 Franklin St
- 43 Washington St
- 244 S Ridge St
- 377 Westchester Ave Unit 5N
- 377 Westchester Ave Unit 1N
- 485 Westchester Ave
- 395 Westchester Ave Unit LC
- 395 Westchester Ave Unit 3A
- 43 Oak St
- 22 Breckenridge Ave
- 47 Smith St
- 431 Irving Ave
- 28 Brookridge Ct
- 133 S Regent St Unit LL
- 133 S Regent St
- 129 S Regent St
- 135 S Regent St
- 125 S Regent St
- 14 Fairview Place
- 12 Fairview Place Unit 1
- 12 Fairview Place Unit 2
- 12 Fairview Place
- 139 S Regent St
- 10 Fairview Place
- 18 Fairview Place
- 8 Fairview Place
- 109 S Regent St
- 55 Clinton St
- 53 Clinton St Unit 1
- 53 Clinton St
- 360 William St
- 143 S Regent St
- 378 William St