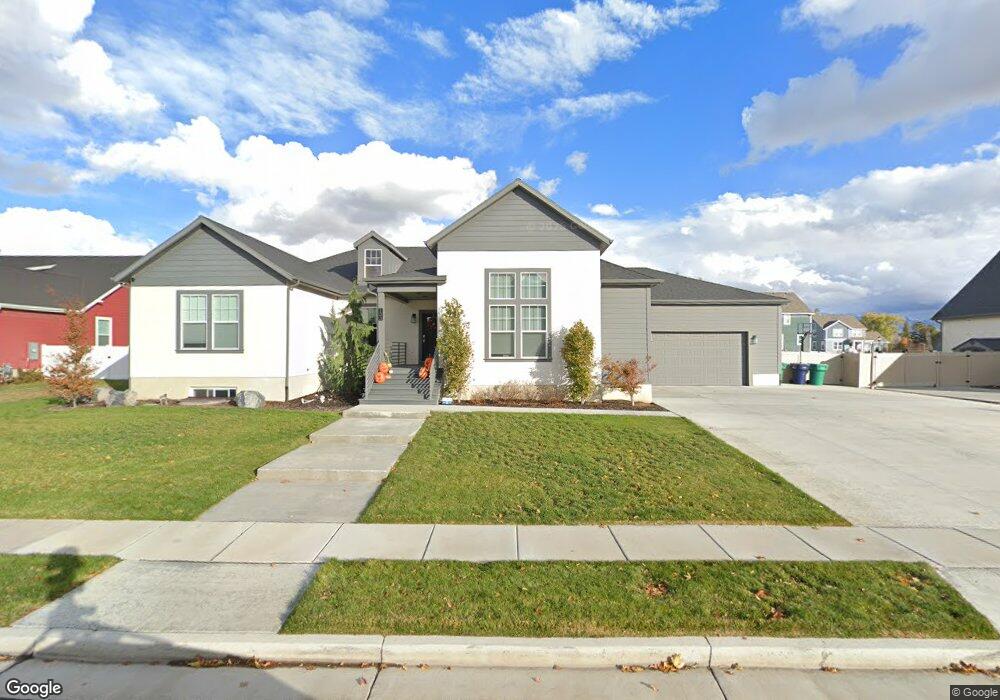
133 S Summer Breeze Ln Unit 110 Layton, UT 84041
Estimated Value: $819,000 - $856,215
3
Beds
3
Baths
4,424
Sq Ft
$189/Sq Ft
Est. Value
About This Home
This home is located at 133 S Summer Breeze Ln Unit 110, Layton, UT 84041 and is currently estimated at $836,304, approximately $189 per square foot. 133 S Summer Breeze Ln Unit 110 is a home located in Davis County with nearby schools including Sand Springs Elementary School, Legacy Junior High School, and Layton High School.
Ownership History
Date
Name
Owned For
Owner Type
Purchase Details
Closed on
Nov 21, 2019
Sold by
Castelli Christopher S and Castelli Suda H
Bought by
Mercer Kassey S and Mercer Anthony G
Current Estimated Value
Home Financials for this Owner
Home Financials are based on the most recent Mortgage that was taken out on this home.
Original Mortgage
$411,000
Outstanding Balance
$360,850
Interest Rate
3.5%
Mortgage Type
New Conventional
Estimated Equity
$475,454
Purchase Details
Closed on
May 30, 2017
Sold by
Castelli Christopher
Bought by
Castelli Christopher S and Castelli Suda H
Home Financials for this Owner
Home Financials are based on the most recent Mortgage that was taken out on this home.
Original Mortgage
$309,000
Interest Rate
3.97%
Mortgage Type
New Conventional
Purchase Details
Closed on
Jan 4, 2017
Sold by
Windmill Development Llc
Bought by
Castelli Christopher
Create a Home Valuation Report for This Property
The Home Valuation Report is an in-depth analysis detailing your home's value as well as a comparison with similar homes in the area
Home Values in the Area
Average Home Value in this Area
Purchase History
| Date | Buyer | Sale Price | Title Company |
|---|---|---|---|
| Mercer Kassey S | -- | Stewart Title Ins Agency | |
| Castelli Christopher S | -- | Charger Title | |
| Castelli Christopher | -- | -- |
Source: Public Records
Mortgage History
| Date | Status | Borrower | Loan Amount |
|---|---|---|---|
| Open | Mercer Kassey S | $411,000 | |
| Previous Owner | Castelli Christopher S | $309,000 |
Source: Public Records
Tax History Compared to Growth
Tax History
| Year | Tax Paid | Tax Assessment Tax Assessment Total Assessment is a certain percentage of the fair market value that is determined by local assessors to be the total taxable value of land and additions on the property. | Land | Improvement |
|---|---|---|---|---|
| 2025 | $4,297 | $451,000 | $149,665 | $301,335 |
| 2024 | $4,031 | $426,250 | $156,505 | $269,745 |
| 2023 | $3,960 | $738,000 | $173,517 | $564,483 |
| 2022 | $4,320 | $437,250 | $95,985 | $341,265 |
| 2021 | $3,849 | $581,000 | $143,918 | $437,082 |
| 2020 | $3,508 | $508,000 | $124,341 | $383,659 |
| 2019 | $3,800 | $539,000 | $119,560 | $419,440 |
| 2018 | $3,533 | $503,000 | $105,730 | $397,270 |
Source: Public Records
Map
Nearby Homes
- 245 S Summer Breeze Ln
- 3535 W Overlook Dr
- 101 S 3600 W
- 3583 W 200 S
- 567 W 3575 S
- 2794 W Gentile St
- 454 N 3550 W
- 2875 N Hill Rd Unit 199
- 2875 N Hill Rd Unit 27
- 3169 S 550 W
- 697 N 3275 W
- 306 S Sunburst Dr
- 3263 W 850 N
- 967 W Yamada Ct
- 3528 S Finch St
- 3067 S Old Emigrant Rd Unit B
- 1139 W 3150 S
- 3637 S Creek Side Ln
- 2184 W Gentile St
- 2674 S 75 E
- 109 S Summer Breeze Ln Unit 111
- 155 S Summer Breeze Ln Unit 123
- 132 S Pinwheel Place Unit 107
- 132 S Pinwheel Place
- 134 S Summer Breeze Ln
- 154 S Pinwheel Place Unit 108
- 101 S Summer Breeze Ln Unit 112
- 114 S Summer Breeze Ln Unit 114
- 3378 W Red Kite Rd
- 112 S Pinwheel Place
- 101 S Summer Breeze Ln
- 3378 W 175 S Unit 116
- 88 S Pinwheel Place Unit 105
- 185 S Summer Breeze Ln
- 131 S Autumn Breeze Ln
- 186 S Pinwheel Place
- 186 S Pinwheel Place Unit 119
- 111 S Autumn Breeze Ln Unit 204
- 111 S Autumn Breeze Ln
- 151 S Autumn Breeze Ln