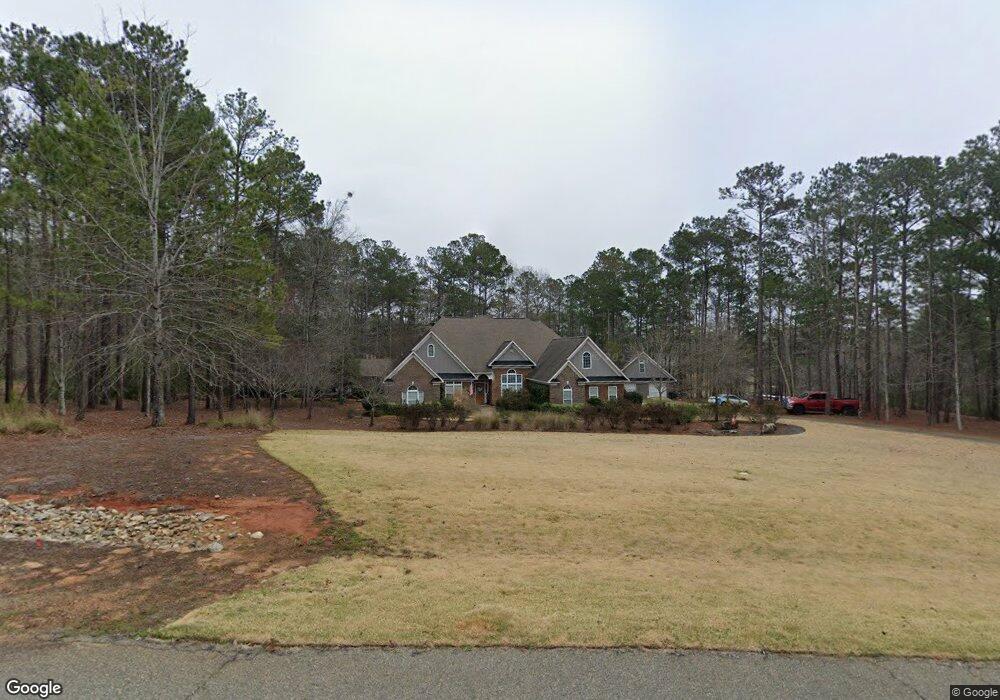
133 Serenity Loop Cataula, GA 31804
Estimated Value: $477,000 - $531,000
4
Beds
3
Baths
2,858
Sq Ft
$180/Sq Ft
Est. Value
About This Home
This home is located at 133 Serenity Loop, Cataula, GA 31804 and is currently estimated at $513,147, approximately $179 per square foot. 133 Serenity Loop is a home with nearby schools including Mulberry Creek Elementary School, Creekside School, and Harris County Carver Middle School.
Ownership History
Date
Name
Owned For
Owner Type
Purchase Details
Closed on
Jun 20, 2018
Sold by
Griggs Shannon O
Bought by
Hopkins Enon C and Hopkins Stacy
Current Estimated Value
Home Financials for this Owner
Home Financials are based on the most recent Mortgage that was taken out on this home.
Original Mortgage
$342,414
Outstanding Balance
$295,556
Interest Rate
4.6%
Mortgage Type
New Conventional
Estimated Equity
$217,591
Purchase Details
Closed on
Aug 29, 2008
Sold by
Emfinger David
Bought by
Griggs Shannon O
Home Financials for this Owner
Home Financials are based on the most recent Mortgage that was taken out on this home.
Original Mortgage
$275,000
Interest Rate
6.48%
Mortgage Type
New Conventional
Purchase Details
Closed on
Oct 2, 2007
Sold by
Willett William L
Bought by
Emfinger Advid
Purchase Details
Closed on
Sep 12, 2007
Sold by
Friwill Llc
Bought by
Willett William L
Create a Home Valuation Report for This Property
The Home Valuation Report is an in-depth analysis detailing your home's value as well as a comparison with similar homes in the area
Purchase History
| Date | Buyer | Sale Price | Title Company |
|---|---|---|---|
| Hopkins Enon C | $400,000 | -- | |
| Griggs Shannon O | $375,000 | -- | |
| Emfinger Advid | $60,000 | -- | |
| Willett William L | $55,000 | -- |
Source: Public Records
Mortgage History
| Date | Status | Borrower | Loan Amount |
|---|---|---|---|
| Open | Hopkins Enon C | $342,414 | |
| Previous Owner | Griggs Shannon O | $275,000 |
Source: Public Records
Tax History
| Year | Tax Paid | Tax Assessment Tax Assessment Total Assessment is a certain percentage of the fair market value that is determined by local assessors to be the total taxable value of land and additions on the property. | Land | Improvement |
|---|---|---|---|---|
| 2025 | $5,158 | $189,005 | $18,000 | $171,005 |
| 2024 | $4,901 | $178,438 | $18,000 | $160,438 |
| 2023 | $4,893 | $178,145 | $18,000 | $160,145 |
| 2022 | $4,599 | $167,112 | $18,000 | $149,112 |
| 2021 | $4,657 | $163,092 | $18,000 | $145,092 |
| 2020 | $4,539 | $158,832 | $18,000 | $140,832 |
| 2014 | $3,897 | $155,008 | $18,000 | $137,008 |
| 2013 | -- | $155,007 | $18,000 | $137,007 |
Source: Public Records
Map
Nearby Homes
- 249 Serenity Loop
- 1278 Jones Rd
- 370 Evergreen Dr
- 607 Turkey Trail
- 262 Pintail Dr
- 172-6 Almond Ridge Dr
- 218 E East Bonacre Rd
- 508 Sweetwater Dr
- 58 Sweetwater Dr
- 3860 Essex Heights Trail
- 509 Sweetwater Dr
- 4555 Mountain Ivy Dr
- 4559 Mountain Ivy Dr
- 9700 Wooldridge Heights Dr
- 292 Bluebird Trail
- 4554 Mountain Ivy Dr
- 4586 Wisteria Ln
- 9586 English Ivy Ct
- 8000 Climbing Ivy Ct
- 50 Grizzly Ct
- 107 Serenity Loop
- 37 Pleasant Ct
- 171 Serenity Loop
- 89 Serenity Loop
- 142 Serenity Loop
- 162 Serenity Loop
- 102 Serenity Loop
- 179 Serenity Loop
- 60 Serenity Loop
- 170 Serenity Loop
- 69 Serenity Loop
- 189 Serenity Loop
- 314 Serenity Loop
- 1969 W Bonacre Rd
- 47 Serenity Loop
- 370 Serenity Loop
- 162 Brook Hollow Trail
- 52 Serenity Loop
- 278 Serenity Loop
- 203 Serenity Loop
Your Personal Tour Guide
Ask me questions while you tour the home.