Estimated Value: $420,000 - $608,274
--
Bed
3
Baths
3,085
Sq Ft
$176/Sq Ft
Est. Value
About This Home
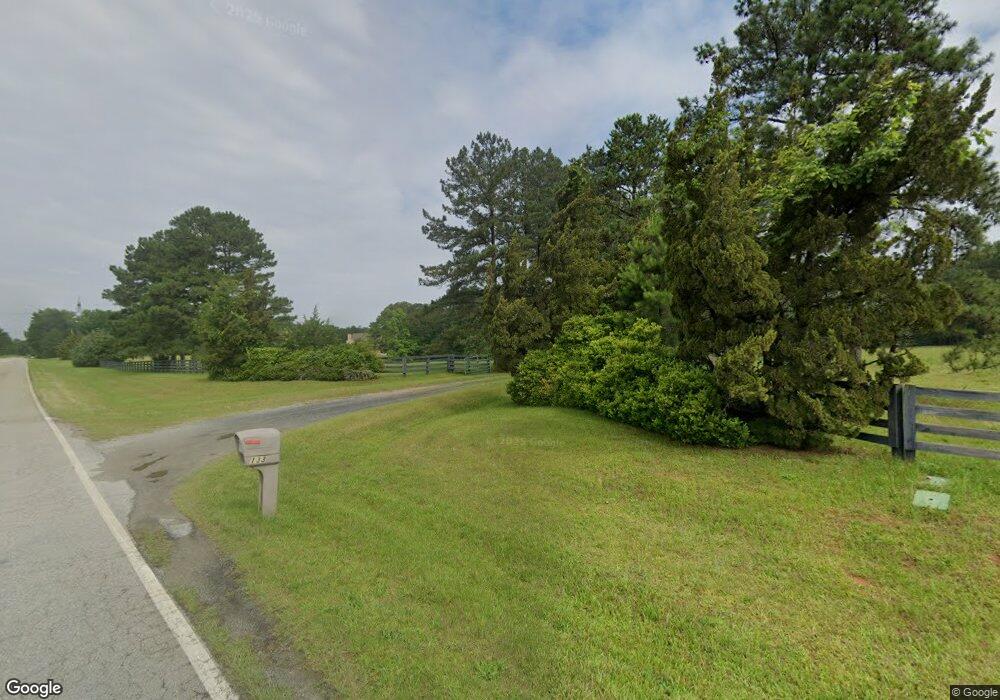
This home is located at 133 Shi Rd, Macon, GA 31220 and is currently estimated at $542,091, approximately $175 per square foot. 133 Shi Rd is a home located in Monroe County with nearby schools including T.G. Scott Elementary School, Mary Persons High School, and Monroe Academy.
Ownership History
Date
Name
Owned For
Owner Type
Purchase Details
Closed on
Aug 8, 2001
Sold by
Deal Davey Ronald
Bought by
Deal Becky B
Current Estimated Value
Purchase Details
Closed on
Sep 2, 1976
Sold by
Warlick F H
Bought by
Deal Davey Ronald
Create a Home Valuation Report for This Property
The Home Valuation Report is an in-depth analysis detailing your home's value as well as a comparison with similar homes in the area
Home Values in the Area
Average Home Value in this Area
Purchase History
| Date | Buyer | Sale Price | Title Company |
|---|---|---|---|
| Deal Becky B | -- | -- | |
| Deal Davey Ronald | $118,000 | -- |
Source: Public Records
Tax History Compared to Growth
Tax History
| Year | Tax Paid | Tax Assessment Tax Assessment Total Assessment is a certain percentage of the fair market value that is determined by local assessors to be the total taxable value of land and additions on the property. | Land | Improvement |
|---|---|---|---|---|
| 2024 | $2,921 | $181,212 | $80,240 | $100,972 |
| 2023 | $1,994 | $166,532 | $80,240 | $86,292 |
| 2022 | $2,324 | $164,452 | $78,160 | $86,292 |
| 2021 | $2,400 | $164,452 | $78,160 | $86,292 |
| 2020 | $2,454 | $164,452 | $78,160 | $86,292 |
| 2019 | $2,468 | $164,452 | $78,160 | $86,292 |
| 2018 | $2,470 | $164,452 | $78,160 | $86,292 |
| 2017 | $4,780 | $164,452 | $78,160 | $86,292 |
| 2016 | $2,340 | $164,452 | $78,160 | $86,292 |
| 2015 | $2,214 | $164,452 | $0 | $0 |
| 2014 | $2,132 | $164,452 | $0 | $0 |
Source: Public Records
Map
Nearby Homes
- 8827 Estes Rd
- 11 Fawn Dr
- 1122 Irongate
- 1193 Pea Ridge Rd
- 112 Irongate
- 8757 Estes Rd
- 8692 Estes Rd
- 158 Caroline Ct
- 202 Hilltop Cir
- Lot 15-A-2 Creekside Ln
- Lot 15-A-1 Creekside Ln
- Lot 26-A-2 Creekside Trail
- 905 Natures Trail
- 0 Old Rumble Rd
- TRACTS 1 & 5 Old Rumble Rd
- TRACTS 2-4 Old Rumble Rd
- Lot 26-A-1 Creekside Trail
- Lot 27-A-1 Creekside Trail