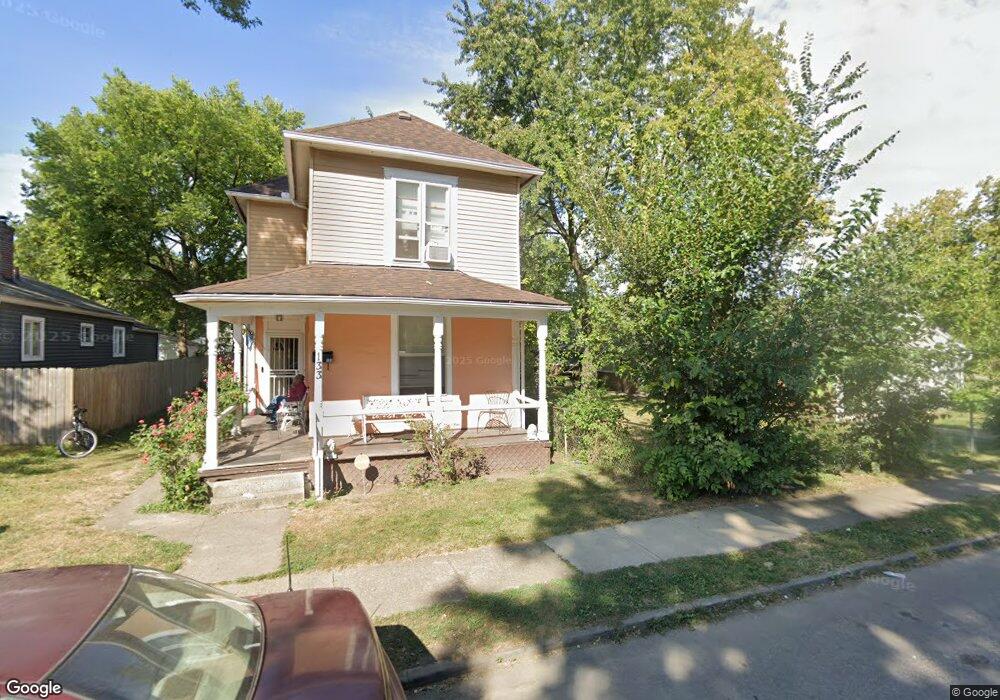
133 Stevens Ave Columbus, OH 43222
Franklinton NeighborhoodEstimated Value: $93,000 - $200,000
2
Beds
1
Bath
1,191
Sq Ft
$120/Sq Ft
Est. Value
About This Home
This home is located at 133 Stevens Ave, Columbus, OH 43222 and is currently estimated at $143,486, approximately $120 per square foot. 133 Stevens Ave is a home located in Franklin County with nearby schools including Starling PK-8, West High School, and Educational Academy For Boys & Girls.
Ownership History
Date
Name
Owned For
Owner Type
Purchase Details
Closed on
Jun 15, 2007
Sold by
Chubb Angela D
Bought by
Chubb Mary L
Current Estimated Value
Purchase Details
Closed on
Sep 20, 1982
Bought by
Chubb Angela D
Create a Home Valuation Report for This Property
The Home Valuation Report is an in-depth analysis detailing your home's value as well as a comparison with similar homes in the area
Home Values in the Area
Average Home Value in this Area
Purchase History
| Date | Buyer | Sale Price | Title Company |
|---|---|---|---|
| Chubb Mary L | -- | None Available | |
| Chubb Angela D | -- | -- |
Source: Public Records
Tax History
| Year | Tax Paid | Tax Assessment Tax Assessment Total Assessment is a certain percentage of the fair market value that is determined by local assessors to be the total taxable value of land and additions on the property. | Land | Improvement |
|---|---|---|---|---|
| 2025 | $1,141 | $35,220 | $4,660 | $30,560 |
| 2024 | $1,141 | $35,220 | $4,660 | $30,560 |
| 2023 | $1,154 | $35,210 | $4,655 | $30,555 |
| 2022 | $165 | $11,940 | $980 | $10,960 |
| 2021 | $166 | $11,940 | $980 | $10,960 |
| 2020 | $166 | $11,940 | $980 | $10,960 |
| 2019 | $73 | $9,950 | $810 | $9,140 |
| 2018 | $145 | $9,950 | $810 | $9,140 |
| 2017 | $156 | $9,950 | $810 | $9,140 |
| 2016 | $239 | $12,360 | $1,160 | $11,200 |
| 2015 | $217 | $12,360 | $1,160 | $11,200 |
| 2014 | $218 | $12,360 | $1,160 | $11,200 |
| 2013 | $149 | $13,755 | $1,295 | $12,460 |
Source: Public Records
Map
Nearby Homes
- 117 Stevens Ave
- 101 Stevens Ave Unit 103
- 63 Stevens Ave
- 57 Stevens Ave Unit 59
- 57 N Guilford Ave
- 48 N Guilford Ave
- 95-97 N Central Ave
- 154-156 N Central Ave
- 122 N Central Ave
- 63 Hayden Ave
- 39 N Princeton Ave Unit 41
- 29 N Princeton Ave
- 44 Brehl Ave
- 76 Brehl Ave
- 130 Chicago Ave
- 33 S Princeton Ave
- 137 Wisconsin Ave
- 117 Dana Ave
- 158 Wisconsin Ave
- 82 N Princeton Ave
- 133 Stevens Ave
- 129 Stevens Ave
- 137-143 Stevens Ave
- 137 Stevens Ave
- 137 Stevens Ave Unit 143
- 143 Stevens Ave Unit 137
- 143 Stevens Ave
- 125 Stevens Ave
- 0 Schultz Ave
- 147 Stevens Ave
- 130 Schultz Ave
- 142 Schultz Ave
- 121 Stevens Ave
- 126 Schultz Ave
- 148 Schultz Ave Unit 150
- 122 Schultz Ave
- 155 Stevens Ave
- 111 Stevens Ave
- 156 Schultz Ave
- 161 Stevens Ave
Your Personal Tour Guide
Ask me questions while you tour the home.