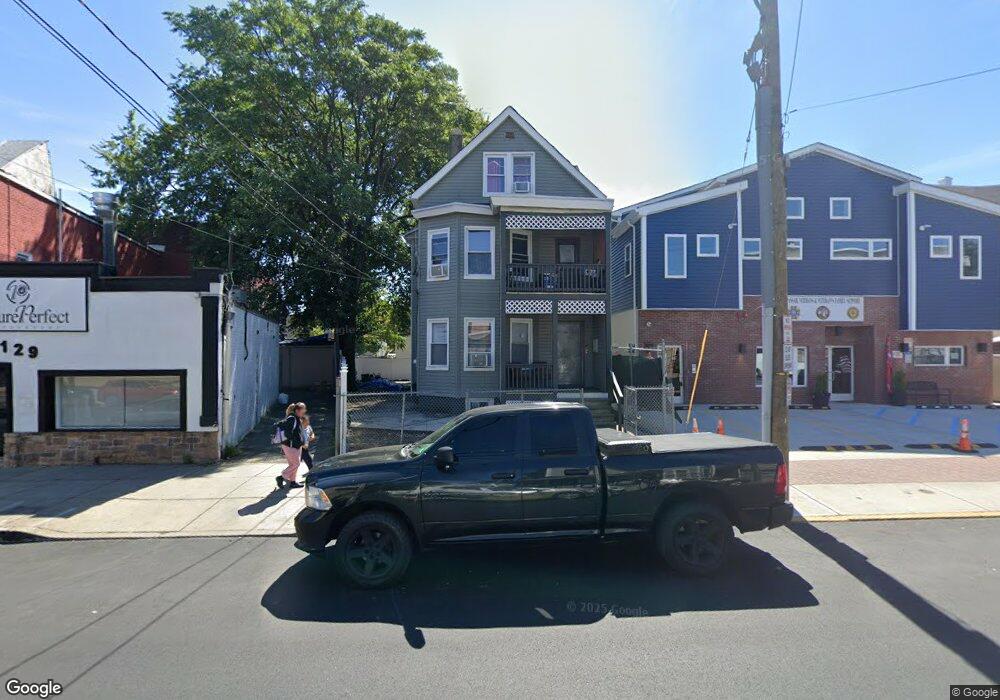
133 Summer St Passaic, NJ 07055
Estimated Value: $402,579 - $713,000
--
Bed
--
Bath
2,370
Sq Ft
$261/Sq Ft
Est. Value
About This Home
This home is located at 133 Summer St, Passaic, NJ 07055 and is currently estimated at $617,395, approximately $260 per square foot. 133 Summer St is a home located in Passaic County with nearby schools including Passaic High School # 12, Passaic Arts and Science Charter School, and St Nicholas Ukrainian Catholic School.
Ownership History
Date
Name
Owned For
Owner Type
Purchase Details
Closed on
Oct 27, 2022
Sold by
Maco Blanca
Bought by
Flores Jessica
Current Estimated Value
Purchase Details
Closed on
Jul 23, 2003
Sold by
Hawkins Harold
Bought by
Padilla Blanca
Home Financials for this Owner
Home Financials are based on the most recent Mortgage that was taken out on this home.
Original Mortgage
$173,700
Interest Rate
6.31%
Mortgage Type
Purchase Money Mortgage
Create a Home Valuation Report for This Property
The Home Valuation Report is an in-depth analysis detailing your home's value as well as a comparison with similar homes in the area
Home Values in the Area
Average Home Value in this Area
Purchase History
| Date | Buyer | Sale Price | Title Company |
|---|---|---|---|
| Flores Jessica | -- | -- | |
| Flores Jessica | -- | None Listed On Document | |
| Padilla Blanca | $193,000 | -- |
Source: Public Records
Mortgage History
| Date | Status | Borrower | Loan Amount |
|---|---|---|---|
| Previous Owner | Padilla Blanca | $173,700 |
Source: Public Records
Tax History Compared to Growth
Tax History
| Year | Tax Paid | Tax Assessment Tax Assessment Total Assessment is a certain percentage of the fair market value that is determined by local assessors to be the total taxable value of land and additions on the property. | Land | Improvement |
|---|---|---|---|---|
| 2025 | $10,918 | $264,800 | $66,300 | $198,500 |
| 2024 | $10,603 | $264,800 | $66,300 | $198,500 |
| 2022 | $10,285 | $264,800 | $66,300 | $198,500 |
| 2021 | $9,956 | $264,800 | $66,300 | $198,500 |
| 2020 | $9,880 | $264,800 | $66,300 | $198,500 |
| 2019 | $10,711 | $291,300 | $66,300 | $225,000 |
| 2018 | $10,481 | $291,300 | $66,300 | $225,000 |
| 2017 | $10,158 | $291,300 | $66,300 | $225,000 |
| 2016 | $9,811 | $291,300 | $66,300 | $225,000 |
| 2015 | $10,905 | $137,700 | $55,900 | $81,800 |
| 2014 | $10,237 | $137,700 | $55,900 | $81,800 |
Source: Public Records
Map
Nearby Homes