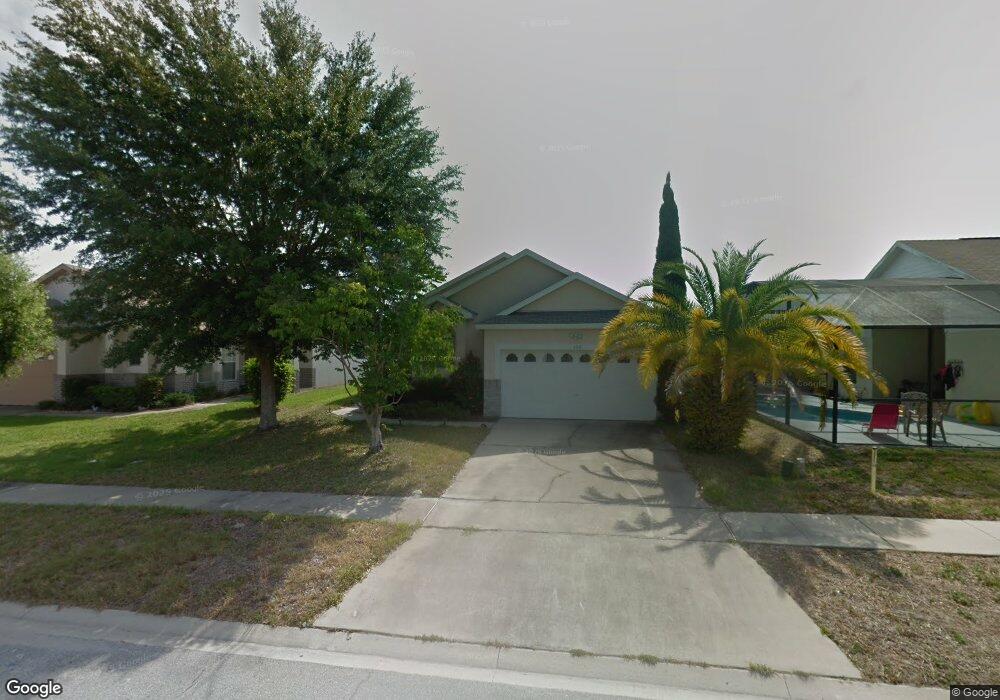
133 Sunny Oak Trail Kissimmee, FL 34746
South Kissimmee NeighborhoodEstimated Value: $370,000 - $405,000
4
Beds
2
Baths
1,740
Sq Ft
$221/Sq Ft
Est. Value
About This Home
This home is located at 133 Sunny Oak Trail, Kissimmee, FL 34746 and is currently estimated at $384,707, approximately $221 per square foot. 133 Sunny Oak Trail is a home located in Osceola County with nearby schools including Central Avenue Elementary School, Kissimmee Middle School, and Poinciana High School.
Ownership History
Date
Name
Owned For
Owner Type
Purchase Details
Closed on
Jan 17, 2020
Sold by
King Olga
Bought by
O & T Family Funds
Current Estimated Value
Purchase Details
Closed on
Sep 14, 2015
Sold by
The Bank Of New York Mellon
Bought by
King Olga
Purchase Details
Closed on
Jun 16, 2015
Sold by
Beavan Thomas W
Bought by
The Bank Of New York Mellon and The Bank Of New York
Purchase Details
Closed on
Apr 25, 2006
Sold by
Hastie Elizabeth
Bought by
Beavan Thomas W and Beavan Jennifer A
Home Financials for this Owner
Home Financials are based on the most recent Mortgage that was taken out on this home.
Original Mortgage
$225,000
Interest Rate
7.12%
Mortgage Type
Negative Amortization
Purchase Details
Closed on
Sep 15, 2000
Sold by
Greater Const Corp
Bought by
Hastie Elizabeth
Home Financials for this Owner
Home Financials are based on the most recent Mortgage that was taken out on this home.
Original Mortgage
$125,350
Interest Rate
8.05%
Create a Home Valuation Report for This Property
The Home Valuation Report is an in-depth analysis detailing your home's value as well as a comparison with similar homes in the area
Home Values in the Area
Average Home Value in this Area
Purchase History
| Date | Buyer | Sale Price | Title Company |
|---|---|---|---|
| O & T Family Funds | -- | None Available | |
| King Olga | $158,000 | Attorney | |
| The Bank Of New York Mellon | -- | None Available | |
| Beavan Thomas W | $305,000 | Stewart Approved Title Inc | |
| Hastie Elizabeth | $179,100 | -- |
Source: Public Records
Mortgage History
| Date | Status | Borrower | Loan Amount |
|---|---|---|---|
| Previous Owner | Beavan Thomas W | $225,000 | |
| Previous Owner | Hastie Elizabeth | $125,350 |
Source: Public Records
Tax History Compared to Growth
Tax History
| Year | Tax Paid | Tax Assessment Tax Assessment Total Assessment is a certain percentage of the fair market value that is determined by local assessors to be the total taxable value of land and additions on the property. | Land | Improvement |
|---|---|---|---|---|
| 2024 | $5,327 | $354,500 | $75,000 | $279,500 |
| 2023 | $5,327 | $260,513 | $0 | $0 |
| 2022 | $4,674 | $270,900 | $40,000 | $230,900 |
| 2021 | $4,241 | $215,300 | $34,000 | $181,300 |
| 2020 | $3,970 | $201,100 | $32,000 | $169,100 |
| 2019 | $3,771 | $180,500 | $28,000 | $152,500 |
| 2018 | $3,526 | $167,600 | $24,000 | $143,600 |
| 2017 | $3,394 | $155,100 | $22,000 | $133,100 |
| 2016 | $3,292 | $148,200 | $22,000 | $126,200 |
| 2015 | $3,184 | $141,700 | $22,000 | $119,700 |
| 2014 | $3,011 | $138,600 | $22,000 | $116,600 |
Source: Public Records
Map
Nearby Homes
- 131 S Roma Way
- 4694 Prairie Point Blvd
- 162 Seneca Point Trail
- 4533 Oakbrook Ct
- 121 Las Fuentes Dr
- 4646 Prairie Point Blvd
- 195 Hideaway Beach Ln
- 418 Marcello Blvd
- 4704 Cheyenne Point Trail
- 4628 Prairie Point Blvd
- 221 Las Fuentes Dr
- 4651 Golden Beach Ct
- 427 Marcello Blvd
- 368 Marcello Blvd
- 447 Marcello Blvd
- 4601 Daisy Dr
- 4778 Vero Beach Place
- 102 Leafwood Ln
- 518 Marcello Blvd
- 153 Barefoot Beach Way
- 131 Sunny Oak Trail
- 4517 Alaqua Trail
- 4515 Alaqua Trail
- 4513 Alaqua Trail
- 129 Sunny Oak Trail
- 4509 Alaqua Trail
- 127 Sunny Oak Trail
- 4986 Worchester Dr
- 5005 Worchester Dr
- 4987 Worchester Dr
- 4975 Worchester Dr
- 5010 Worchester Dr
- 4870 Worchester Dr
- 4828 Edensbridge Ln
- 4934 Worchester Dr
- 4952 Worchester Dr
- 4940 Worchester Dr
- 4999 Worchester Dr
- 4987 Worchester Dr
- 4946 Worchester Dr