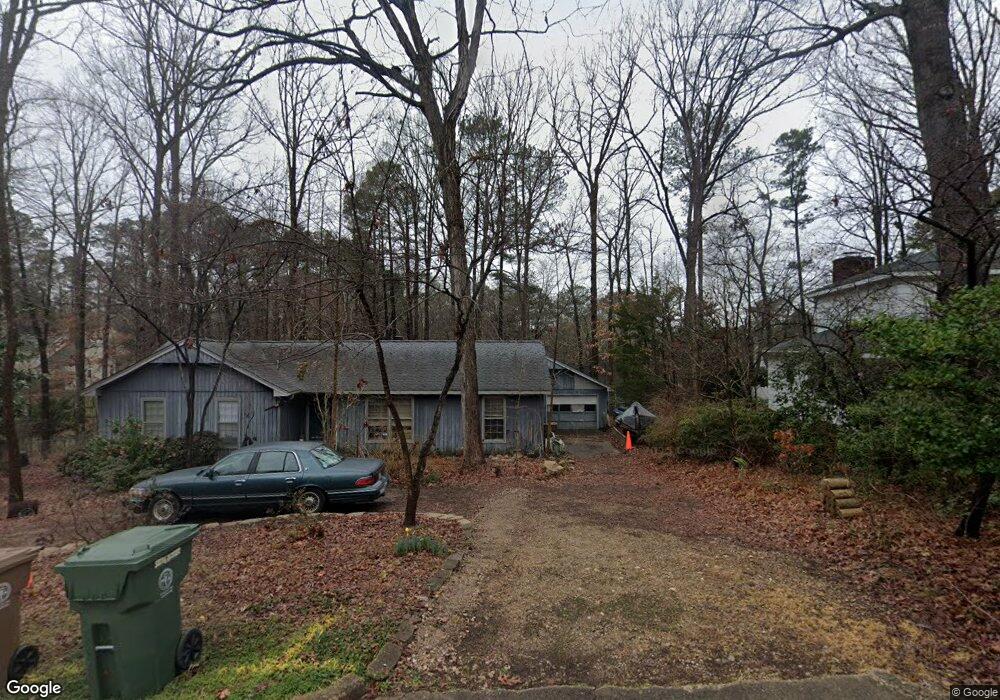
133 Sycamore St Cary, NC 27513
South Cary NeighborhoodEstimated Value: $413,000 - $464,962
3
Beds
2
Baths
1,530
Sq Ft
$293/Sq Ft
Est. Value
About This Home
This home is located at 133 Sycamore St, Cary, NC 27513 and is currently estimated at $448,741, approximately $293 per square foot. 133 Sycamore St is a home located in Wake County with nearby schools including Weatherstone Elementary School, East Cary Middle School, and Cary High School.
Ownership History
Date
Name
Owned For
Owner Type
Purchase Details
Closed on
Jul 5, 2005
Sold by
Resing Charles J
Bought by
Thompson Dudley E and Thompson Susan S
Current Estimated Value
Purchase Details
Closed on
Apr 19, 2002
Sold by
Dettlaff Christopher M and Dettlaff Rachel S
Bought by
Resing Charles J
Home Financials for this Owner
Home Financials are based on the most recent Mortgage that was taken out on this home.
Original Mortgage
$140,790
Interest Rate
6.89%
Mortgage Type
FHA
Create a Home Valuation Report for This Property
The Home Valuation Report is an in-depth analysis detailing your home's value as well as a comparison with similar homes in the area
Home Values in the Area
Average Home Value in this Area
Purchase History
| Date | Buyer | Sale Price | Title Company |
|---|---|---|---|
| Thompson Dudley E | $150,000 | -- | |
| Resing Charles J | $143,000 | -- |
Source: Public Records
Mortgage History
| Date | Status | Borrower | Loan Amount |
|---|---|---|---|
| Previous Owner | Resing Charles J | $140,790 |
Source: Public Records
Tax History Compared to Growth
Tax History
| Year | Tax Paid | Tax Assessment Tax Assessment Total Assessment is a certain percentage of the fair market value that is determined by local assessors to be the total taxable value of land and additions on the property. | Land | Improvement |
|---|---|---|---|---|
| 2025 | $3,614 | $419,356 | $210,000 | $209,356 |
| 2024 | $3,536 | $419,356 | $210,000 | $209,356 |
| 2023 | $2,745 | $271,967 | $120,000 | $151,967 |
| 2022 | $2,643 | $271,967 | $120,000 | $151,967 |
| 2021 | $2,590 | $271,967 | $120,000 | $151,967 |
| 2020 | $2,604 | $271,967 | $120,000 | $151,967 |
| 2019 | $2,015 | $186,293 | $68,000 | $118,293 |
| 2018 | $1,891 | $186,293 | $68,000 | $118,293 |
| 2017 | $1,818 | $186,293 | $68,000 | $118,293 |
| 2016 | $0 | $186,293 | $68,000 | $118,293 |
| 2015 | -- | $174,404 | $56,000 | $118,404 |
| 2014 | -- | $174,404 | $56,000 | $118,404 |
Source: Public Records
Map
Nearby Homes
- 117 Red Bud Ct
- 213 Howland Ave
- 102 Joel Ct
- 204 Phauff Ct
- 101 Joel Ct
- 143 Hedgerow Ct
- 101 Murphy Dr
- 114 Canterfield Rd
- 316 Howland Ave
- 534 Matheson Place
- 207 High House Rd
- 209 High House Rd
- 710 Samuel Cary Dr
- 1009 Contessa Dr
- 1149 Contessa Dr
- 1017 Frank Page Dr
- 631 Springfork Dr Unit 5C3
- 923 Springfork Dr Unit 621
- 432 W Park St
- 418 Madison Ave