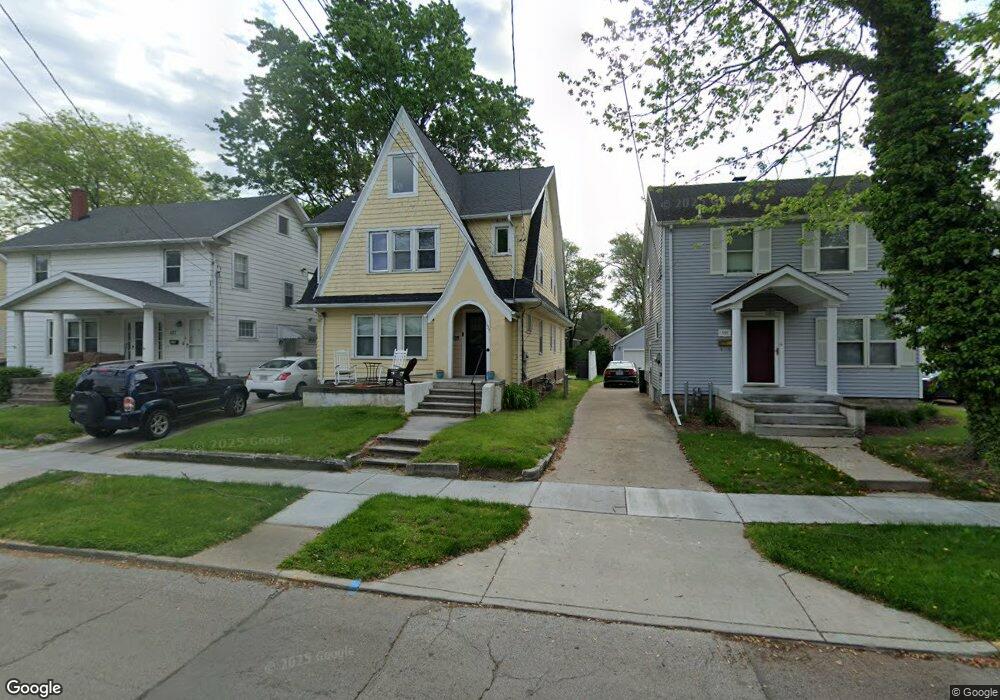
133 Troup Ave Bowling Green, OH 43402
Estimated Value: $180,000 - $231,158
5
Beds
2
Baths
2,060
Sq Ft
$101/Sq Ft
Est. Value
About This Home
This home is located at 133 Troup Ave, Bowling Green, OH 43402 and is currently estimated at $208,540, approximately $101 per square foot. 133 Troup Ave is a home located in Wood County with nearby schools including Bowling Green High School, Montessori School Of Bowling Green, and Bowling Green Christian Academy.
Ownership History
Date
Name
Owned For
Owner Type
Purchase Details
Closed on
Dec 13, 2019
Sold by
Troupe Avenue Llc
Bought by
Js Bay Llc
Current Estimated Value
Purchase Details
Closed on
Jul 13, 2010
Sold by
Crague Rose Marie and Crague Kenneth E
Bought by
Troupe Avenue Llc
Purchase Details
Closed on
Jul 6, 2010
Sold by
Loomis Jerry Paul and Loomis Barbara J
Bought by
Troupe Avenue Llc
Purchase Details
Closed on
Jun 22, 2010
Sold by
Loomis John Michael and Hanf Jennifer M
Bought by
Troupe Avenue Llc
Purchase Details
Closed on
Jun 8, 2010
Sold by
Loomis Joseph Leon and Loomis Lucy C
Bought by
Troupe Avenue Llc
Purchase Details
Closed on
Apr 7, 2010
Sold by
Estate Of Marcella Carter Loomis
Bought by
Loomis Joseph Leon and Crague Rose Marie
Purchase Details
Closed on
Dec 17, 2004
Sold by
Estate Of Irven Lyle Loomis
Bought by
Loomis Marcella Carter
Purchase Details
Closed on
Jan 1, 1990
Bought by
Loomis Marcella
Create a Home Valuation Report for This Property
The Home Valuation Report is an in-depth analysis detailing your home's value as well as a comparison with similar homes in the area
Home Values in the Area
Average Home Value in this Area
Purchase History
| Date | Buyer | Sale Price | Title Company |
|---|---|---|---|
| Js Bay Llc | $160,000 | None Available | |
| Troupe Avenue Llc | -- | Attorney | |
| Troupe Avenue Llc | -- | Attorney | |
| Troupe Avenue Llc | -- | Attorney | |
| Troupe Avenue Llc | -- | Attorney | |
| Loomis Joseph Leon | -- | None Available | |
| Loomis Marcella Carter | -- | -- | |
| Loomis Marcella | -- | -- |
Source: Public Records
Tax History Compared to Growth
Tax History
| Year | Tax Paid | Tax Assessment Tax Assessment Total Assessment is a certain percentage of the fair market value that is determined by local assessors to be the total taxable value of land and additions on the property. | Land | Improvement |
|---|---|---|---|---|
| 2024 | $2,508 | $56,700 | $8,225 | $48,475 |
| 2023 | $2,508 | $56,710 | $8,230 | $48,480 |
| 2021 | $2,014 | $45,260 | $6,860 | $38,400 |
| 2020 | $2,007 | $45,260 | $6,860 | $38,400 |
| 2019 | $1,869 | $39,970 | $6,860 | $33,110 |
| 2018 | $1,859 | $39,970 | $6,860 | $33,110 |
| 2017 | $765 | $39,970 | $6,860 | $33,110 |
| 2016 | $1,496 | $32,340 | $6,860 | $25,480 |
| 2015 | $1,496 | $32,340 | $6,860 | $25,480 |
| 2014 | $1,551 | $32,340 | $6,860 | $25,480 |
| 2013 | $835 | $32,340 | $6,860 | $25,480 |
Source: Public Records
Map
Nearby Homes
- Lot 41 S Prospect St
- Lot 40 S Prospect St
- Lot 36 S Prospect St
- 210 W Wooster St
- 608 S Summit St
- 629 S Summit St
- 448 S Church St
- 518 S Grove St
- 545 Wallace Ave
- 0 Haskins Rd Unit 6132516
- 1048 N Main St
- 519 Knollwood Dr
- 29 Darlyn Dr
- 733 Conneaut Ave
- 893 W Wooster St
- 315 Parkview Dr
- 4 Mackenzie Ct
- 7 Augusta Dr Unit 7
- 1024 Clark St
- 14580 Sand Ridge Rd
- 137 Troup Ave
- 127 Troup Ave
- 141 Troup Ave
- 123 Troup Ave
- 145 Troup Ave
- 124 University Ln
- 2 University Ln
- 119 Troup Ave
- 120 University Ln
- 149 Troup Ave
- 0 University Ln
- 130 Troup Ave
- 136 Troup Ave
- 126 Troup Ave Unit 128
- 1 University Ln
- 153 Troup Ave
- 140 Troup Ave
- 0 Troup Ave
- 122 Troup Ave
- 3 University Ln