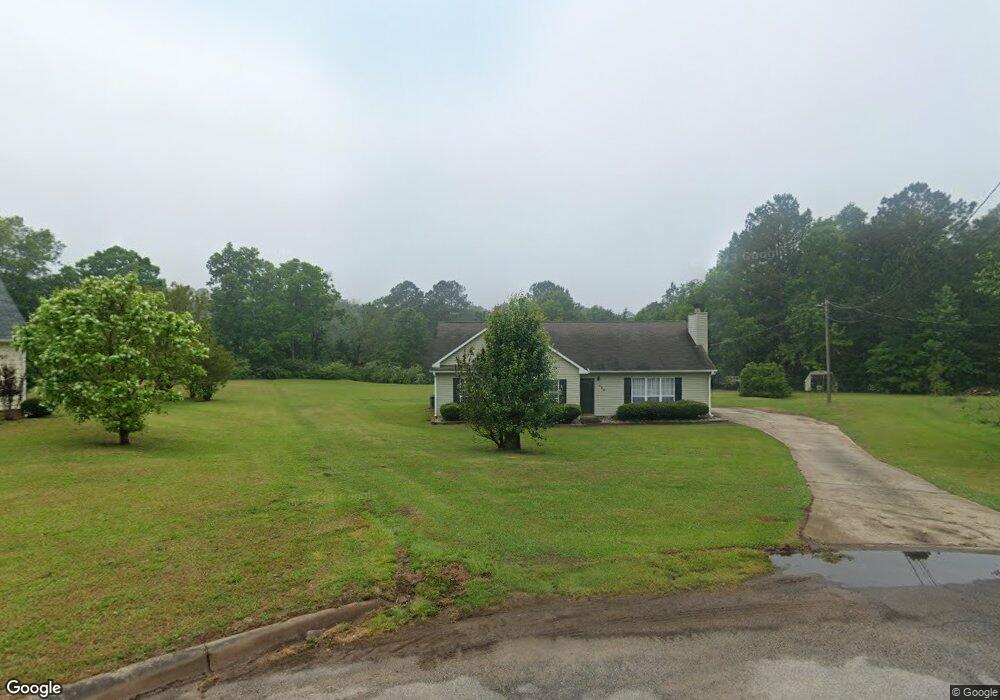
133 Twelve Oaks Dr Lagrange, GA 30241
Estimated Value: $219,891 - $253,000
3
Beds
3
Baths
1,505
Sq Ft
$156/Sq Ft
Est. Value
About This Home
This home is located at 133 Twelve Oaks Dr, Lagrange, GA 30241 and is currently estimated at $235,473, approximately $156 per square foot. 133 Twelve Oaks Dr is a home located in Troup County with nearby schools including Callaway Elementary School, Hogansville Elementary School, and Callaway Middle School.
Ownership History
Date
Name
Owned For
Owner Type
Purchase Details
Closed on
Jan 27, 2021
Sold by
Gholston Christine G
Bought by
Gholston Kendra
Current Estimated Value
Home Financials for this Owner
Home Financials are based on the most recent Mortgage that was taken out on this home.
Original Mortgage
$68,800
Outstanding Balance
$60,999
Interest Rate
2.6%
Mortgage Type
New Conventional
Estimated Equity
$174,474
Purchase Details
Closed on
Sep 26, 2003
Sold by
Weaver Shelia R
Bought by
Gates Georgia R
Purchase Details
Closed on
May 4, 2000
Sold by
Scott Charles A and Scott Claudia P
Bought by
Weaver Shelia R
Purchase Details
Closed on
Sep 4, 1996
Sold by
Smith Marla
Bought by
Scott Charles A and Scott Claudia P
Purchase Details
Closed on
Jul 20, 1992
Sold by
Dan-Ric
Bought by
Smith Marla
Purchase Details
Closed on
Nov 7, 1990
Bought by
Dan-Ric
Create a Home Valuation Report for This Property
The Home Valuation Report is an in-depth analysis detailing your home's value as well as a comparison with similar homes in the area
Purchase History
| Date | Buyer | Sale Price | Title Company |
|---|---|---|---|
| Gholston Kendra | $86,000 | -- | |
| Gates Georgia R | $104,900 | -- | |
| Weaver Shelia R | $84,900 | -- | |
| Scott Charles A | $82,500 | -- | |
| Smith Marla | $71,800 | -- | |
| Dan-Ric | -- | -- |
Source: Public Records
Mortgage History
| Date | Status | Borrower | Loan Amount |
|---|---|---|---|
| Open | Gholston Kendra | $68,800 |
Source: Public Records
Tax History
| Year | Tax Paid | Tax Assessment Tax Assessment Total Assessment is a certain percentage of the fair market value that is determined by local assessors to be the total taxable value of land and additions on the property. | Land | Improvement |
|---|---|---|---|---|
| 2025 | $1,823 | $72,684 | $10,000 | $62,684 |
| 2024 | $1,633 | $61,852 | $10,000 | $51,852 |
| 2023 | $1,624 | $61,536 | $10,000 | $51,536 |
| 2022 | $1,592 | $59,016 | $10,000 | $49,016 |
| 2021 | $1,269 | $42,084 | $8,000 | $34,084 |
| 2020 | $1,209 | $42,084 | $8,000 | $34,084 |
| 2019 | $1,175 | $40,932 | $6,000 | $34,932 |
| 2018 | $1,175 | $40,932 | $6,000 | $34,932 |
| 2017 | $1,175 | $40,932 | $6,000 | $34,932 |
| 2016 | $1,147 | $40,013 | $6,000 | $34,013 |
| 2015 | $1,101 | $38,427 | $6,000 | $32,427 |
| 2014 | $1,051 | $36,720 | $6,000 | $30,720 |
| 2013 | -- | $28,963 | $6,000 | $22,963 |
Source: Public Records
Map
Nearby Homes
- 91 Almond Rd
- 453 E Mount Zion Church Rd
- 425 Mount Zion Church Rd
- 90 Beaver Run
- 2477 Upper Big Springs Rd
- 142 Carr Rd
- 100 Dove Creek Ct
- 810 Callaway Church Rd
- 194 Hines Rd
- 125 Hazel Way
- 132 Hines Rd
- 56 John Lovelace Rd
- 86 John Lovelace Rd
- 10 Whitfield Rd
- 0 Hines Rd Unit TRACT A
- 0 Hines Rd Unit 10488606
- 123 Wexford Dr
- 200 River Meadow Dr
- 300 Glenhaven Dr Unit 1D
- 302 Glenhaven Dr Unit 2D
- 131 Twelve Oaks Dr
- 124 Twelve Oaks Dr
- 129 Twelve Oaks Dr
- 122 Twelve Oaks Dr
- 218 Almond Rd
- 120 Twelve Oaks Dr
- 127 Twelve Oaks Dr
- 110 Twelve Oaks Dr
- 112 Twelve Oaks Dr
- 108 Twelve Oaks Dr
- 125 Twelve Oaks Dr
- 114 Twelve Oaks Dr
- 118 Twelve Oaks Dr
- 106 Twelve Oaks Dr
- 116 Twelve Oaks Dr
- 116 Twelve Oaks Dr Unit II
- 123 Twelve Oaks Dr
- 230 Almond Rd
- 104 Twelve Oaks Dr
- 109 Twelve Oaks Dr
Your Personal Tour Guide
Ask me questions while you tour the home.