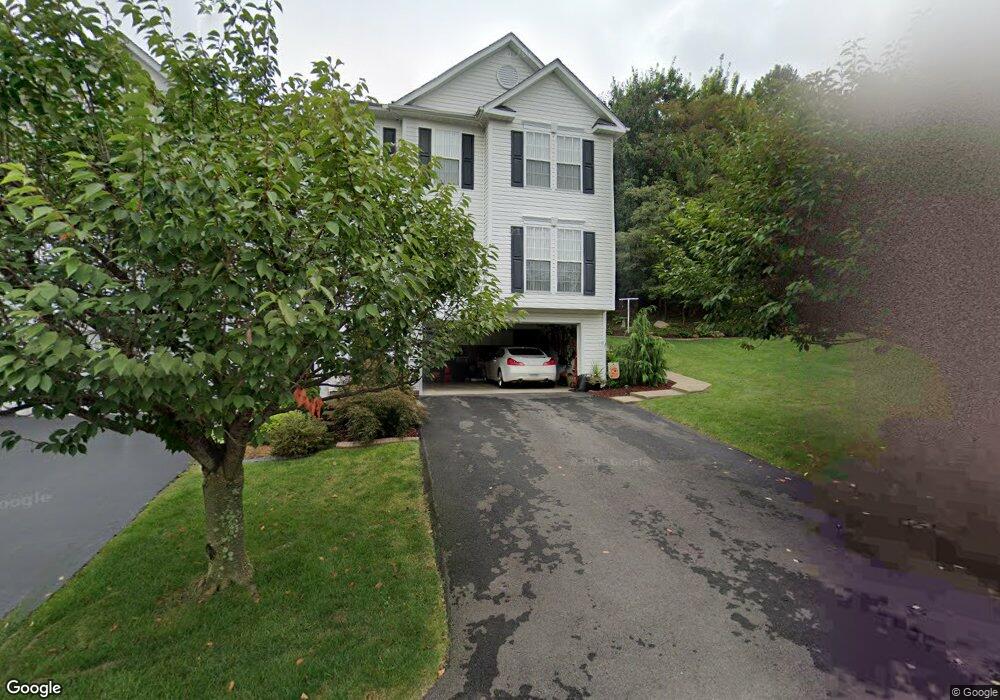
133 Unity Square Greensburg, PA 15601
Estimated Value: $248,581 - $369,000
3
Beds
3
Baths
1,704
Sq Ft
$178/Sq Ft
Est. Value
About This Home
This home is located at 133 Unity Square, Greensburg, PA 15601 and is currently estimated at $303,145, approximately $177 per square foot. 133 Unity Square is a home located in Westmoreland County with nearby schools including Greater Latrobe Junior High School, Greater Latrobe Senior High School, and High Acres School.
Ownership History
Date
Name
Owned For
Owner Type
Purchase Details
Closed on
May 16, 2016
Sold by
Bradley Bonnie J
Bought by
Harvin Gary R and Koshir Vicki L
Current Estimated Value
Purchase Details
Closed on
Mar 17, 2010
Sold by
Mongell Michael and Mongell Noelle R
Bought by
Bradley Bonnie J
Home Financials for this Owner
Home Financials are based on the most recent Mortgage that was taken out on this home.
Original Mortgage
$100,000
Interest Rate
5.05%
Mortgage Type
New Conventional
Purchase Details
Closed on
Dec 26, 2003
Sold by
Unity Square Associates Lp
Bought by
Unity Square Homeowners Assn Inc
Purchase Details
Closed on
Jan 25, 2002
Sold by
Patalsky Ray and Patalsky Anna
Bought by
Unity Square Associates Lp
Create a Home Valuation Report for This Property
The Home Valuation Report is an in-depth analysis detailing your home's value as well as a comparison with similar homes in the area
Home Values in the Area
Average Home Value in this Area
Purchase History
| Date | Buyer | Sale Price | Title Company |
|---|---|---|---|
| Harvin Gary R | $177,000 | None Available | |
| Bradley Bonnie J | $162,500 | None Available | |
| Unity Square Homeowners Assn Inc | -- | -- | |
| Unity Square Associates Lp | $325,000 | -- |
Source: Public Records
Mortgage History
| Date | Status | Borrower | Loan Amount |
|---|---|---|---|
| Previous Owner | Bradley Bonnie J | $100,000 |
Source: Public Records
Tax History Compared to Growth
Tax History
| Year | Tax Paid | Tax Assessment Tax Assessment Total Assessment is a certain percentage of the fair market value that is determined by local assessors to be the total taxable value of land and additions on the property. | Land | Improvement |
|---|---|---|---|---|
| 2025 | $3,653 | $30,270 | $1,990 | $28,280 |
| 2024 | $3,653 | $30,270 | $1,990 | $28,280 |
| 2023 | $778 | $30,270 | $1,990 | $28,280 |
| 2022 | $3,351 | $30,270 | $1,990 | $28,280 |
| 2021 | $3,320 | $30,270 | $1,990 | $28,280 |
| 2020 | $3,267 | $30,270 | $1,990 | $28,280 |
| 2019 | $3,222 | $30,270 | $1,990 | $28,280 |
| 2018 | $3,207 | $30,270 | $1,990 | $28,280 |
| 2017 | $3,124 | $30,270 | $1,990 | $28,280 |
| 2016 | $732 | $30,270 | $1,990 | $28,280 |
| 2015 | $732 | $30,270 | $1,990 | $28,280 |
| 2014 | -- | $30,270 | $1,990 | $28,280 |
Source: Public Records
Map
Nearby Homes
- 108 Unity Square
- 14 Sassafras Ln
- 1212 Mountain View Dr
- 470 Donohoe Rd
- 3024 Ben Venue Dr
- 3007 Ben Venue Dr
- Lot 318 Hemingway Dr
- 499 White School Rd
- #23 LOT Timberland Dr
- #19 LOT Timberland Dr
- 21 LOT Timberland Dr
- # 17 LOT Timberland Dr
- #16 LOT Timberland Dr
- #15 LOT Timberland Dr
- #9 LOT Timberland Dr
- 3150 Princeton Rd
- 5009 Linwood Court (Lot #206)
- 188 Meadow Spring Rd
- 5209 Route 30
- 140 Greendale Dr
- 135 Unity Square
- 131 Unity Square Unit E
- 137 Unity Square
- 137 Unity Square Unit C
- 129 Unity Square Unit D
- 139 Unity Square
- 127 Unity Square
- 124 Unity Square Unit A
- 141 Unity Square
- 122 Unity Square
- 125 Unity Square Unit B
- 120 Unity Square Unit A
- 123 Unity Square
- 118 Unity Square Unit B
- 114 Unity Square
- 116 Unity Square Unit C
- 121 Unity Square
- 10 Unity Square
- 16 Unity Square
- 12 Unity Square