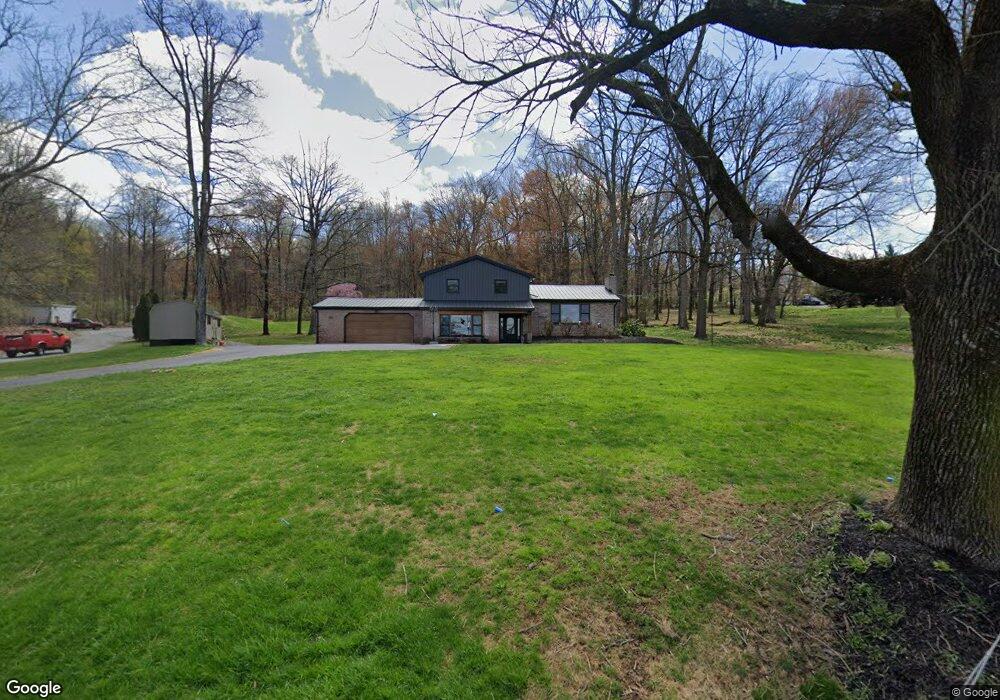
133 Valley View Dr Ephrata, PA 17522
Estimated Value: $426,000 - $477,000
3
Beds
1
Bath
1,399
Sq Ft
$327/Sq Ft
Est. Value
About This Home
This home is located at 133 Valley View Dr, Ephrata, PA 17522 and is currently estimated at $457,443, approximately $326 per square foot. 133 Valley View Dr is a home located in Lancaster County with nearby schools including Highland Elementary School, Ephrata Intermediate School, and Ephrata Senior High School.
Ownership History
Date
Name
Owned For
Owner Type
Purchase Details
Closed on
Sep 7, 2010
Sold by
Gray Angela M
Bought by
Gray Kent D
Current Estimated Value
Purchase Details
Closed on
Jun 6, 2005
Sold by
Weaver Lloyd W and Weaver Vesta G
Bought by
Gray Kent D and Gray Angela M
Purchase Details
Closed on
Nov 1, 2002
Sold by
Martin James L and Martin Sandra Mae
Bought by
Gray Kent D and Gray Angela M
Home Financials for this Owner
Home Financials are based on the most recent Mortgage that was taken out on this home.
Original Mortgage
$160,000
Interest Rate
6.04%
Purchase Details
Closed on
Apr 24, 2002
Sold by
Hassell John C and Hassell Esther M
Bought by
Martin James L and Martin Sandra M
Home Financials for this Owner
Home Financials are based on the most recent Mortgage that was taken out on this home.
Original Mortgage
$355,000
Interest Rate
7.05%
Mortgage Type
Construction
Create a Home Valuation Report for This Property
The Home Valuation Report is an in-depth analysis detailing your home's value as well as a comparison with similar homes in the area
Home Values in the Area
Average Home Value in this Area
Purchase History
| Date | Buyer | Sale Price | Title Company |
|---|---|---|---|
| Gray Kent D | -- | None Available | |
| Gray Kent D | $30,000 | -- | |
| Gray Kent D | $200,000 | -- | |
| Martin James L | $150,000 | First American Title Ins Co |
Source: Public Records
Mortgage History
| Date | Status | Borrower | Loan Amount |
|---|---|---|---|
| Previous Owner | Gray Kent D | $160,000 | |
| Previous Owner | Martin James L | $355,000 |
Source: Public Records
Tax History Compared to Growth
Tax History
| Year | Tax Paid | Tax Assessment Tax Assessment Total Assessment is a certain percentage of the fair market value that is determined by local assessors to be the total taxable value of land and additions on the property. | Land | Improvement |
|---|---|---|---|---|
| 2025 | $5,359 | $233,000 | $120,900 | $112,100 |
| 2024 | $5,359 | $233,000 | $120,900 | $112,100 |
| 2023 | $5,222 | $233,000 | $120,900 | $112,100 |
| 2022 | $5,103 | $233,000 | $120,900 | $112,100 |
| 2021 | $4,970 | $233,000 | $120,900 | $112,100 |
| 2020 | $4,970 | $233,000 | $120,900 | $112,100 |
| 2019 | $4,900 | $233,000 | $120,900 | $112,100 |
| 2018 | $3,822 | $233,000 | $120,900 | $112,100 |
| 2017 | $6,106 | $238,000 | $63,100 | $174,900 |
| 2016 | $6,082 | $238,000 | $63,100 | $174,900 |
| 2015 | $1,215 | $238,000 | $63,100 | $174,900 |
| 2014 | $4,538 | $238,000 | $63,100 | $174,900 |
Source: Public Records
Map
Nearby Homes
- 158 Valley View Dr
- 553 Ridge Ave
- 14 Hazelwood Cir
- 306 Spring Glen Dr
- 336 Ridge Ave
- 11 Carriage Ln
- 214 Linda Terrace
- 704 Lincoln Ave
- 212 Irene Ave
- 474 N Maple St
- 0 Wabash Rd
- 623 N State St
- 110 E Pine St
- 189 Ridge Ave
- 96 Spruce St
- 18 E Pine St
- 300 Pfautz Hill Rd
- 111 Ridge Ave
- 335 Lincoln Ave
- 323 Lincoln Ave
- 131 Valley View Dr
- 21 Dogwood Dr
- 144 Valley View Dr
- 129 Valley View Dr
- 146 Valley View Dr
- 147 Valley View Dr
- 148 Valley View Dr
- 32 Dogwood Dr
- 34 Dogwood Dr
- 149 Valley View Dr
- 150 Valley View Dr
- 36 Dogwood Dr
- 27 Michelle Dr
- 0 Dogwood Dr
- 152 Valley View Dr
- 38 Dogwood Dr
- 26 Michelle Dr
- 153 Valley View Dr
- 40 Dogwood Dr
- 155 Valley View Dr