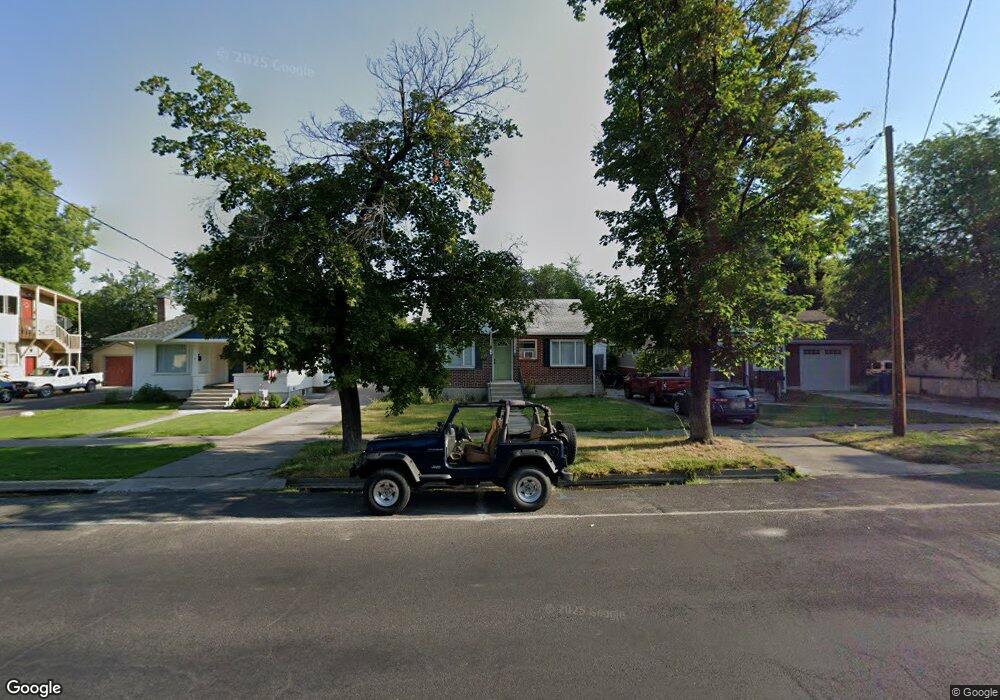
133 W 400 N Logan, UT 84321
Ellis NeighborhoodEstimated Value: $354,000 - $423,000
4
Beds
2
Baths
1,912
Sq Ft
$199/Sq Ft
Est. Value
About This Home
This home is located at 133 W 400 N, Logan, UT 84321 and is currently estimated at $379,774, approximately $198 per square foot. 133 W 400 N is a home located in Cache County with nearby schools including Ellis School, Mount Logan Middle School, and Logan High School.
Ownership History
Date
Name
Owned For
Owner Type
Purchase Details
Closed on
Aug 22, 2024
Sold by
Wallis Sean and Wallis Kent R
Bought by
Wallis Sean Myler
Current Estimated Value
Home Financials for this Owner
Home Financials are based on the most recent Mortgage that was taken out on this home.
Original Mortgage
$56,069
Outstanding Balance
$55,335
Interest Rate
6.89%
Mortgage Type
New Conventional
Estimated Equity
$324,439
Purchase Details
Closed on
May 20, 2021
Sold by
Wallis Sean
Bought by
Wallis Sean and Wallis Kent R
Home Financials for this Owner
Home Financials are based on the most recent Mortgage that was taken out on this home.
Original Mortgage
$255,000
Interest Rate
3.1%
Mortgage Type
New Conventional
Purchase Details
Closed on
Nov 6, 2020
Sold by
Messer Aubrey A
Bought by
Wallis Sean
Purchase Details
Closed on
Feb 26, 2018
Sold by
Maxwell Rebecca
Bought by
Messer Aurbrey A
Home Financials for this Owner
Home Financials are based on the most recent Mortgage that was taken out on this home.
Original Mortgage
$152,192
Interest Rate
4.5%
Mortgage Type
FHA
Purchase Details
Closed on
Jul 10, 2017
Sold by
Oneill Rebecca
Bought by
Maxwell Rebecca
Purchase Details
Closed on
Jun 1, 2016
Sold by
Neill Rebecca O
Bought by
Neill Rebecca O
Home Financials for this Owner
Home Financials are based on the most recent Mortgage that was taken out on this home.
Original Mortgage
$110,250
Interest Rate
3.59%
Mortgage Type
New Conventional
Purchase Details
Closed on
May 16, 2014
Sold by
Neill Jack O
Bought by
Neill Rebecca O
Home Financials for this Owner
Home Financials are based on the most recent Mortgage that was taken out on this home.
Original Mortgage
$130,000
Interest Rate
4.38%
Mortgage Type
Seller Take Back
Purchase Details
Closed on
Apr 1, 2014
Sold by
Lewis Weston S
Bought by
Neill Jack O
Home Financials for this Owner
Home Financials are based on the most recent Mortgage that was taken out on this home.
Original Mortgage
$130,000
Interest Rate
4.38%
Mortgage Type
Seller Take Back
Purchase Details
Closed on
Feb 5, 2013
Sold by
Lewis Weston S and Lewis Jennifer C
Bought by
Lewis Weston S
Create a Home Valuation Report for This Property
The Home Valuation Report is an in-depth analysis detailing your home's value as well as a comparison with similar homes in the area
Home Values in the Area
Average Home Value in this Area
Purchase History
| Date | Buyer | Sale Price | Title Company |
|---|---|---|---|
| Wallis Sean Myler | -- | Northern Title | |
| Wallis Sean | -- | Cache Title | |
| Wallis Sean | -- | American Secure Title Logan | |
| Messer Aurbrey A | -- | -- | |
| Maxwell Rebecca | -- | Advanced Title Insurance | |
| Neill Rebecca O | -- | Advanced Title | |
| Neill Rebecca O | -- | Cache Title | |
| Neill Jack O | -- | Cache Title Logan | |
| Lewis Weston S | -- | Cache Title Logan |
Source: Public Records
Mortgage History
| Date | Status | Borrower | Loan Amount |
|---|---|---|---|
| Open | Wallis Sean Myler | $56,069 | |
| Previous Owner | Wallis Sean | $255,000 | |
| Previous Owner | Messer Aurbrey A | $152,192 | |
| Previous Owner | Neill Rebecca O | $110,250 | |
| Previous Owner | Neill Rebecca O | $130,000 |
Source: Public Records
Tax History
| Year | Tax Paid | Tax Assessment Tax Assessment Total Assessment is a certain percentage of the fair market value that is determined by local assessors to be the total taxable value of land and additions on the property. | Land | Improvement |
|---|---|---|---|---|
| 2025 | $1,455 | $188,220 | $0 | $0 |
| 2024 | $1,503 | $188,220 | $0 | $0 |
| 2023 | $1,569 | $187,340 | $0 | $0 |
| 2022 | $168 | $187,345 | $0 | $0 |
| 2021 | $136 | $235,050 | $42,000 | $193,050 |
| 2020 | $1,229 | $190,500 | $42,000 | $148,500 |
| 2019 | $1,284 | $190,500 | $42,000 | $148,500 |
| 2018 | $1,148 | $155,456 | $42,000 | $113,456 |
| 2017 | $1,101 | $78,815 | $0 | $0 |
| 2016 | $1,141 | $73,315 | $0 | $0 |
| 2015 | $1,063 | $73,315 | $0 | $0 |
| 2014 | $961 | $73,315 | $0 | $0 |
| 2013 | -- | $71,690 | $0 | $0 |
Source: Public Records
Map
Nearby Homes
Your Personal Tour Guide
Ask me questions while you tour the home.