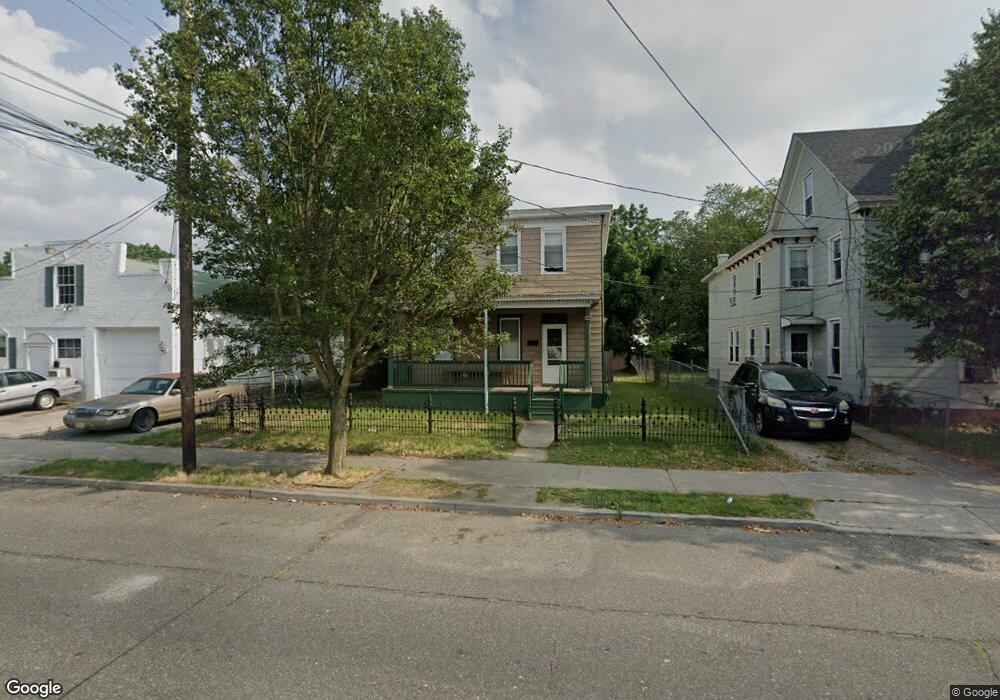
133 W Broad St Millville, NJ 08332
Estimated Value: $70,912 - $75,000
--
Bed
--
Bath
1,512
Sq Ft
$48/Sq Ft
Est. Value
About This Home
This home is located at 133 W Broad St, Millville, NJ 08332 and is currently estimated at $72,978, approximately $48 per square foot. 133 W Broad St is a home located in Cumberland County with nearby schools including R.D. Wood Elementary School, Lakeside Middle School, and Memorial High School.
Ownership History
Date
Name
Owned For
Owner Type
Purchase Details
Closed on
Nov 10, 2025
Sold by
Byrde Enterprises Llc
Bought by
Spf 2 Llc
Current Estimated Value
Home Financials for this Owner
Home Financials are based on the most recent Mortgage that was taken out on this home.
Original Mortgage
$150,200
Outstanding Balance
$138,039
Interest Rate
6.27%
Mortgage Type
Construction
Estimated Equity
-$65,061
Purchase Details
Closed on
Jul 25, 2025
Sold by
Makos 3 John R and Vurganov Toli
Bought by
Byrde Enterprises Llc
Purchase Details
Closed on
Sep 25, 2000
Sold by
Homecomings Financial
Bought by
Vurganov Toli and Montgomery Arthur
Purchase Details
Closed on
Jun 11, 1996
Sold by
Riley Pearl E
Bought by
Redd Lolita
Home Financials for this Owner
Home Financials are based on the most recent Mortgage that was taken out on this home.
Original Mortgage
$35,000
Interest Rate
5%
Create a Home Valuation Report for This Property
The Home Valuation Report is an in-depth analysis detailing your home's value as well as a comparison with similar homes in the area
Home Values in the Area
Average Home Value in this Area
Purchase History
| Date | Buyer | Sale Price | Title Company |
|---|---|---|---|
| Spf 2 Llc | $130,000 | Dekel Abstract | |
| Byrde Enterprises Llc | $70,000 | Surety Title | |
| Byrde Enterprises Llc | $70,000 | Surety Title | |
| Vurganov Toli | $21,500 | -- | |
| Redd Lolita | $35,000 | -- |
Source: Public Records
Mortgage History
| Date | Status | Borrower | Loan Amount |
|---|---|---|---|
| Open | Spf 2 Llc | $150,200 | |
| Previous Owner | Redd Lolita | $35,000 |
Source: Public Records
Tax History Compared to Growth
Tax History
| Year | Tax Paid | Tax Assessment Tax Assessment Total Assessment is a certain percentage of the fair market value that is determined by local assessors to be the total taxable value of land and additions on the property. | Land | Improvement |
|---|---|---|---|---|
| 2025 | $3,054 | $77,800 | $15,900 | $61,900 |
| 2024 | $3,054 | $77,800 | $15,900 | $61,900 |
| 2023 | $3,028 | $77,800 | $15,900 | $61,900 |
| 2022 | $2,949 | $77,800 | $15,900 | $61,900 |
| 2021 | $2,854 | $77,800 | $15,900 | $61,900 |
| 2020 | $2,806 | $77,800 | $15,900 | $61,900 |
| 2019 | $2,676 | $77,800 | $15,900 | $61,900 |
| 2018 | $2,621 | $77,800 | $15,900 | $61,900 |
| 2017 | $2,597 | $77,800 | $15,900 | $61,900 |
| 2016 | $2,564 | $77,800 | $15,900 | $61,900 |
| 2015 | $2,507 | $77,800 | $15,900 | $61,900 |
| 2014 | $2,511 | $77,800 | $15,900 | $61,900 |
Source: Public Records
Map
Nearby Homes
- 552 Columbia Ave
- 550 Columbia Ave
- 414 W Powell St
- 525 Dock St Unit B
- 525 Dock St
- 525 Dock St Unit A
- 504 Columbia Ave
- 500 Columbia Ave
- 10 E Broad St
- 502 N High St
- 709 & 707 Buck St
- 108 110 E Oak St
- 503 N 2nd St
- 228 High St N
- 507 N 2nd St
- 705 N 2nd St
- 404 Sharp St N
- 402 Sharp St N
- 807 N 2nd St
- 302 W Main St
- 135 W Broad St
- 137 W Broad St
- 120 W Broad St
- 139 W Broad St
- 141 W Broad St
- 143 W Broad St
- 555 Columbia Ave Unit 557
- 147 W Broad St
- 559 Columbia Ave
- 553 Columbia Ave
- 601 Church St
- 149 W Broad St
- 136 W Broad St
- 603 Church St Unit 605
- 124 W Broad St
- 151 W Broad St
- 563 Columbia Ave
- 111 W Broad St
- 547 Columbia Ave
- 607 Church St