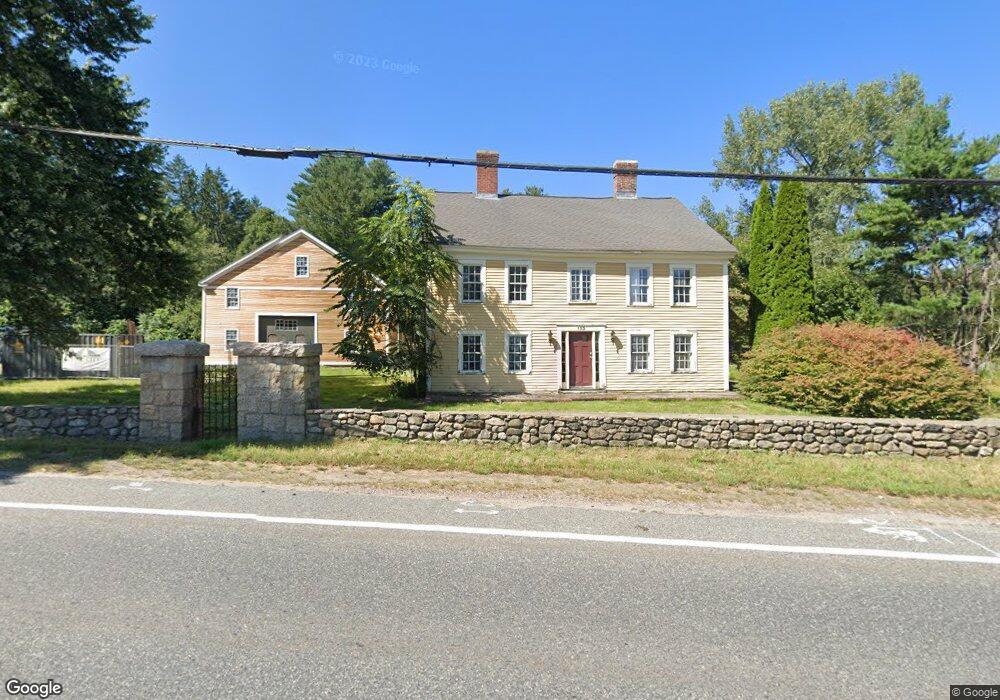
133 W Union St Ashland, MA 01721
Estimated Value: $623,000
8
Beds
4
Baths
5,122
Sq Ft
$122/Sq Ft
Est. Value
About This Home
This home is located at 133 W Union St, Ashland, MA 01721 and is currently priced at $623,000, approximately $121 per square foot. 133 W Union St is a home located in Middlesex County with nearby schools including William Pittaway Elementary School, David Mindess Elementary School, and Henry E. Warren Elementary School.
Ownership History
Date
Name
Owned For
Owner Type
Purchase Details
Closed on
Aug 14, 2018
Sold by
Interim Rt
Bought by
Ashland Town Of
Current Estimated Value
Purchase Details
Closed on
May 17, 2013
Sold by
Swift Acquisitions Llc
Bought by
Interim Rt
Purchase Details
Closed on
Feb 16, 2010
Sold by
Foley Robert E
Bought by
Swift Acquisitions Llc
Home Financials for this Owner
Home Financials are based on the most recent Mortgage that was taken out on this home.
Original Mortgage
$375,000
Interest Rate
5.12%
Mortgage Type
Purchase Money Mortgage
Purchase Details
Closed on
Jul 7, 2006
Sold by
West Union Dev Llc
Bought by
Foley Robert E
Home Financials for this Owner
Home Financials are based on the most recent Mortgage that was taken out on this home.
Original Mortgage
$520,000
Interest Rate
6.6%
Mortgage Type
Purchase Money Mortgage
Purchase Details
Closed on
Jun 14, 2005
Sold by
Mcdonagh Thomas M
Bought by
West Union Dev Llc
Home Financials for this Owner
Home Financials are based on the most recent Mortgage that was taken out on this home.
Original Mortgage
$450,000
Interest Rate
5.79%
Mortgage Type
Purchase Money Mortgage
Purchase Details
Closed on
Nov 29, 2002
Sold by
Viscomi Amelia A
Bought by
Dedham Dev Llc
Purchase Details
Closed on
Feb 12, 1999
Sold by
Vlar Rt
Bought by
Viscomi Amelia A
Home Financials for this Owner
Home Financials are based on the most recent Mortgage that was taken out on this home.
Original Mortgage
$337,500
Interest Rate
6.78%
Mortgage Type
Purchase Money Mortgage
Purchase Details
Closed on
Nov 1, 1994
Sold by
Johannesen Allen D and Wheeler Joanne
Bought by
Vlar Rt
Home Financials for this Owner
Home Financials are based on the most recent Mortgage that was taken out on this home.
Original Mortgage
$268,000
Interest Rate
8.65%
Mortgage Type
Purchase Money Mortgage
Create a Home Valuation Report for This Property
The Home Valuation Report is an in-depth analysis detailing your home's value as well as a comparison with similar homes in the area
Home Values in the Area
Average Home Value in this Area
Purchase History
| Date | Buyer | Sale Price | Title Company |
|---|---|---|---|
| Ashland Town Of | $3,500,000 | -- | |
| Interim Rt | $50,000 | -- | |
| Swift Acquisitions Llc | $335,000 | -- | |
| Foley Robert E | $650,000 | -- | |
| West Union Dev Llc | $650,000 | -- | |
| Dedham Dev Llc | $366,000 | -- | |
| Viscomi Amelia A | $450,000 | -- | |
| Vlar Rt | $335,000 | -- |
Source: Public Records
Mortgage History
| Date | Status | Borrower | Loan Amount |
|---|---|---|---|
| Previous Owner | Swift Acquisitions Llc | $375,000 | |
| Previous Owner | Foley Robert E | $520,000 | |
| Previous Owner | West Union Dev Llc | $450,000 | |
| Previous Owner | Vlar Rt | $337,500 | |
| Previous Owner | Vlar Rt | $500,000 | |
| Previous Owner | Vlar Rt | $268,000 |
Source: Public Records
Tax History Compared to Growth
Tax History
| Year | Tax Paid | Tax Assessment Tax Assessment Total Assessment is a certain percentage of the fair market value that is determined by local assessors to be the total taxable value of land and additions on the property. | Land | Improvement |
|---|---|---|---|---|
| 2025 | $0 | $1,434,800 | $766,300 | $668,500 |
| 2024 | $0 | $1,365,700 | $766,300 | $599,400 |
| 2023 | $0 | $1,213,800 | $700,300 | $513,500 |
| 2022 | $8,141 | $1,120,900 | $675,300 | $445,600 |
| 2021 | $0 | $1,087,900 | $675,300 | $412,600 |
| 2020 | $10,671 | $508,400 | $215,400 | $293,000 |
| 2019 | $0 | $508,400 | $215,400 | $293,000 |
| 2018 | $8,141 | $490,100 | $212,200 | $277,900 |
| 2017 | $7,874 | $471,500 | $208,300 | $263,200 |
| 2016 | $7,691 | $452,400 | $203,200 | $249,200 |
| 2015 | $7,461 | $431,300 | $190,300 | $241,000 |
| 2014 | $8,356 | $480,500 | $235,900 | $244,600 |
Source: Public Records
Map
Nearby Homes
- 9 Olive St
- 28-30 Olive St
- 60 Frankland Rd
- 11 Voyagers Ln
- 101 Olive St
- 13 Clark St
- 20 Braeburn Ln
- 0 Ballard Highland Marietta Unit 73391306
- 203 Pleasant St
- 638 Main St
- 0 Cross St
- 25 Prospect St
- 49 Prospect St
- 10 Clinton St
- 6 New Castle Rd
- The Majesty Plan at Constitution Village
- The Alexander Plan at Constitution Village
- The Countess Plan at Constitution Village
- Jasmine Glory Plan at Constitution Village
- 3 Blueberry Hill Ln
- 136 W Union St
- 132 W Union St
- 124 W Union St
- 142 W Union St
- 146 W Union St
- 117 W Union St
- 151 W Union St
- 116 W Union St
- 10 Edgewood Dr
- 150 W Union St
- 112 W Union St
- 11 Frankland Rd
- 12 Indian Spring Rd
- 16 Indian Spring Rd
- 8 Indian Spring Rd
- 20 Indian Spring Rd
- 2 Indian Spring Rd
- 22 Indian Spring Rd
- 110 W Union St
- 9 Edgewood Dr