Estimated Value: $165,000 - $237,000
3
Beds
2
Baths
1,125
Sq Ft
$179/Sq Ft
Est. Value
About This Home
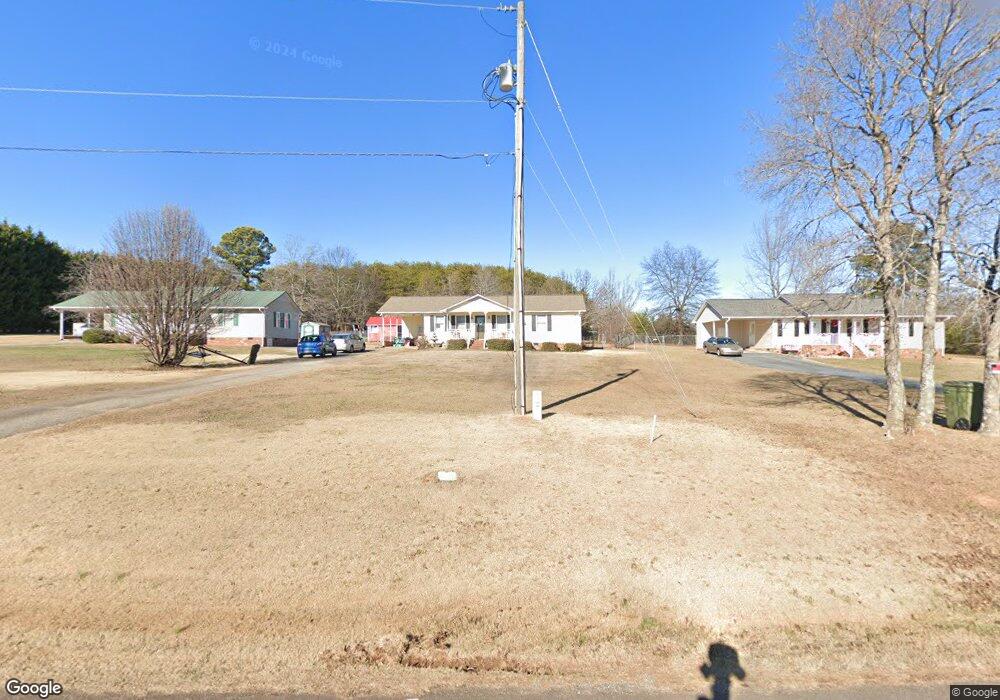
This home is located at 133 Wildflower Ln, Inman, SC 29349 and is currently estimated at $201,091, approximately $178 per square foot. 133 Wildflower Ln is a home located in Spartanburg County with nearby schools including Inman Elementary School, T.E. Mabry Middle School, and Chapman High School.
Ownership History
Date
Name
Owned For
Owner Type
Purchase Details
Closed on
May 8, 2014
Sold by
The United States Department Of Housing
Bought by
Cashwell Brittney D
Current Estimated Value
Home Financials for this Owner
Home Financials are based on the most recent Mortgage that was taken out on this home.
Original Mortgage
$66,025
Outstanding Balance
$50,637
Interest Rate
4.5%
Mortgage Type
FHA
Estimated Equity
$150,454
Purchase Details
Closed on
Nov 13, 2012
Sold by
Branch Banking & Trust Company
Bought by
Secretary Of Housing & Urban Development
Purchase Details
Closed on
Sep 20, 2012
Sold by
Horton Kelly M
Bought by
Branch Banking & Trust Company
Purchase Details
Closed on
Jan 28, 2003
Sold by
Chase Manhattan Mortgage Corp
Bought by
Horton Kelly M
Purchase Details
Closed on
Sep 23, 2002
Sold by
Woody Dennis
Bought by
Chase Manhattan Mortgage Corp
Create a Home Valuation Report for This Property
The Home Valuation Report is an in-depth analysis detailing your home's value as well as a comparison with similar homes in the area
Home Values in the Area
Average Home Value in this Area
Purchase History
| Date | Buyer | Sale Price | Title Company |
|---|---|---|---|
| Cashwell Brittney D | $62,900 | -- | |
| Secretary Of Housing & Urban Development | -- | -- | |
| Branch Banking & Trust Company | $60,000 | -- | |
| Horton Kelly M | $74,750 | -- | |
| Chase Manhattan Mortgage Corp | $80,000 | -- |
Source: Public Records
Mortgage History
| Date | Status | Borrower | Loan Amount |
|---|---|---|---|
| Open | Cashwell Brittney D | $66,025 |
Source: Public Records
Tax History Compared to Growth
Tax History
| Year | Tax Paid | Tax Assessment Tax Assessment Total Assessment is a certain percentage of the fair market value that is determined by local assessors to be the total taxable value of land and additions on the property. | Land | Improvement |
|---|---|---|---|---|
| 2025 | $867 | $4,603 | $991 | $3,612 |
| 2024 | $867 | $4,603 | $991 | $3,612 |
| 2023 | $867 | $4,603 | $991 | $3,612 |
| 2022 | $782 | $4,002 | $785 | $3,217 |
| 2021 | $782 | $4,002 | $785 | $3,217 |
| 2020 | $767 | $4,002 | $785 | $3,217 |
| 2019 | $767 | $4,002 | $785 | $3,217 |
| 2018 | $767 | $4,002 | $785 | $3,217 |
| 2017 | $683 | $3,480 | $800 | $2,680 |
| 2016 | $683 | $3,480 | $800 | $2,680 |
| 2015 | $666 | $3,480 | $800 | $2,680 |
| 2014 | $661 | $3,480 | $800 | $2,680 |
Source: Public Records
Map
Nearby Homes
- 128 Cothran Rd
- 155 Cothran Rd
- 415 Grady Dr
- 119 Beechwood Dr
- 140 Golightly St
- 00 State Road S-42-371
- 135 Glendarosa Dr
- 107 Denali St
- 704 Adaline Dr
- 255 Arena Park Dr
- 221 N Main St
- 345 Bishop Hicks Ct
- 103 Guy Cothran Rd
- 111 Guy Cothran Rd
- 123 Guy Cothran Rd
- 9041 Asheville Hwy
- 42 Bishop St
- 2160 Compton Bridge Rd
- 473 Meadow Rd
- 14 Littlefield St
- 127 Wildflower Ln
- 139 Wildflower Ln
- 0 Cothran Rd
- 115 Wildflower Ln
- 1533 Compton Bridge Rd
- 121 Wildflower Ln
- 1543 Compton Bridge Rd
- 1523 Compton Bridge Rd
- 109 Wildflower Ln
- 1553 Compton Bridge Rd
- 1559 Compton Bridge Rd
- 730 Windmill Hill Rd
- 746 Windmill Hill Rd
- 736 Windmill Hill Rd
- 451 Cardinal St Unit 461
- 720 Windmill Hill Rd
- 1565 Compton Bridge Rd
- 706 Windmill Hill Rd
- 756 Windmill Hill Rd
- 778 Windmill Hill Rd