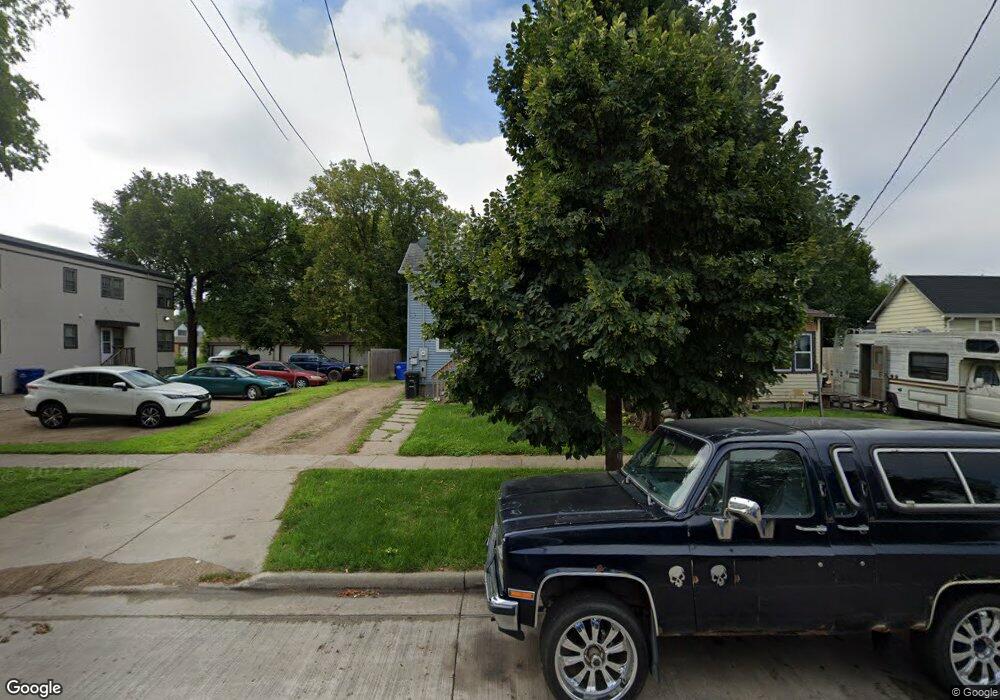
1330 1st Ave S Fargo, ND 58103
Jefferson-Carl NeighborhoodEstimated Value: $152,000 - $200,189
3
Beds
1
Bath
1,716
Sq Ft
$102/Sq Ft
Est. Value
About This Home
This home is located at 1330 1st Ave S, Fargo, ND 58103 and is currently estimated at $175,547, approximately $102 per square foot. 1330 1st Ave S is a home located in Cass County with nearby schools including Jefferson Elementary School, Ben Franklin Middle School, and South High School.
Ownership History
Date
Name
Owned For
Owner Type
Purchase Details
Closed on
Nov 24, 2020
Sold by
Rudd Kenneth B
Bought by
Banker Ronald P
Current Estimated Value
Home Financials for this Owner
Home Financials are based on the most recent Mortgage that was taken out on this home.
Original Mortgage
$132,554
Outstanding Balance
$118,223
Interest Rate
2.8%
Mortgage Type
FHA
Estimated Equity
$57,324
Purchase Details
Closed on
Dec 8, 2017
Sold by
Hofer Justin L
Bought by
Rudd Kenneth B
Home Financials for this Owner
Home Financials are based on the most recent Mortgage that was taken out on this home.
Original Mortgage
$120,000
Interest Rate
3.92%
Mortgage Type
VA
Purchase Details
Closed on
Jul 29, 2010
Sold by
Anastasis Inc
Bought by
Hofer Justin L
Home Financials for this Owner
Home Financials are based on the most recent Mortgage that was taken out on this home.
Original Mortgage
$89,673
Interest Rate
4.81%
Mortgage Type
FHA
Purchase Details
Closed on
Dec 2, 2009
Sold by
Mcbain Valeri L
Bought by
Anastasis Inc
Create a Home Valuation Report for This Property
The Home Valuation Report is an in-depth analysis detailing your home's value as well as a comparison with similar homes in the area
Home Values in the Area
Average Home Value in this Area
Purchase History
| Date | Buyer | Sale Price | Title Company |
|---|---|---|---|
| Banker Ronald P | $135,000 | Fm Title | |
| Rudd Kenneth B | $120,000 | Regency Title | |
| Hofer Justin L | -- | -- | |
| Anastasis Inc | -- | -- |
Source: Public Records
Mortgage History
| Date | Status | Borrower | Loan Amount |
|---|---|---|---|
| Open | Banker Ronald P | $132,554 | |
| Previous Owner | Rudd Kenneth B | $120,000 | |
| Previous Owner | Hofer Justin L | $89,673 |
Source: Public Records
Tax History Compared to Growth
Tax History
| Year | Tax Paid | Tax Assessment Tax Assessment Total Assessment is a certain percentage of the fair market value that is determined by local assessors to be the total taxable value of land and additions on the property. | Land | Improvement |
|---|---|---|---|---|
| 2024 | $4,343 | $58,600 | $8,600 | $50,000 |
| 2023 | $4,354 | $56,350 | $8,600 | $47,750 |
| 2022 | $4,422 | $54,700 | $8,600 | $46,100 |
| 2021 | $1,754 | $54,700 | $8,600 | $46,100 |
| 2020 | $1,719 | $54,700 | $8,600 | $46,100 |
| 2019 | $1,728 | $55,550 | $4,300 | $51,250 |
| 2018 | $1,709 | $55,550 | $4,300 | $51,250 |
| 2017 | $1,693 | $55,550 | $4,300 | $51,250 |
| 2016 | $1,520 | $53,950 | $4,300 | $49,650 |
| 2015 | $887 | $25,400 | $3,000 | $22,400 |
| 2014 | $903 | $48,150 | $3,000 | $45,150 |
| 2013 | $866 | $24,700 | $3,000 | $21,700 |
Source: Public Records
Map
Nearby Homes
- 1450 1st Ave S
- 1117 3rd Ave S
- 1121 4th Ave S
- 1524 1st Ave S
- 1022 3rd Ave S
- 1024 3rd Ave S
- 1317 1st Ave N
- 1419 5th Ave S
- 1529 4th Ave S
- 1124 5th Ave S
- 854 1st Ave S
- 1524 5th Ave S
- 210 11th St N Unit 202
- 210 11th St N Unit 104
- 210 11th St N Unit 103
- 1629 2nd Ave S
- 203 8th St S
- 601 10th St S
- 1110 3rd Ave N Unit 604E
- 1110 3rd Ave N Unit 201E
- 1330 1st Ave S
- 1330 1st Ave S
- 1334 1st Ave S
- 1324 1st Ave S
- 1336 1st Ave S
- 1324 1st Ave S
- 1344 1st Ave S
- 1344 14 1/2 Ave S
- 1320 14 1/2 Ave S
- 1329 1st Ave S
- 1329 1st Ave S
- 1346 1st Ave S
- 1346 1st Ave S
- 1346 1st Ave S
- 1323 1st Ave S
- 1339 1st Ave S
- 1339 1st Ave S
- 1339 1st Ave S
- 1339 1st Ave S
- 1331 2nd Ave S