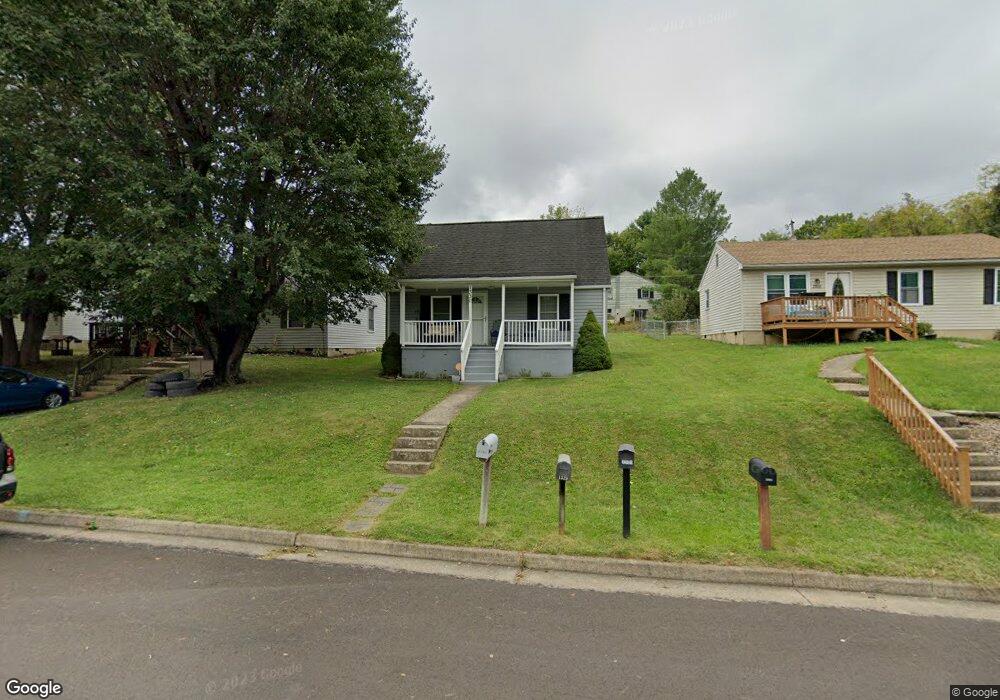
1330 B St Waynesboro, VA 22980
Estimated Value: $213,000 - $252,000
3
Beds
2
Baths
1,110
Sq Ft
$207/Sq Ft
Est. Value
About This Home
This home is located at 1330 B St, Waynesboro, VA 22980 and is currently estimated at $229,792, approximately $207 per square foot. 1330 B St is a home located in Waynesboro City with nearby schools including Wenonah Elementary School, Kate Collins Middle School, and Waynesboro High School.
Ownership History
Date
Name
Owned For
Owner Type
Purchase Details
Closed on
Jul 24, 2008
Sold by
Sandridge Philip
Bought by
Byars Corey S
Current Estimated Value
Home Financials for this Owner
Home Financials are based on the most recent Mortgage that was taken out on this home.
Original Mortgage
$130,945
Outstanding Balance
$85,668
Interest Rate
6.35%
Mortgage Type
FHA
Estimated Equity
$144,124
Purchase Details
Closed on
Aug 9, 2007
Sold by
C J Wood Family Llc
Bought by
Sandridge Phillip
Create a Home Valuation Report for This Property
The Home Valuation Report is an in-depth analysis detailing your home's value as well as a comparison with similar homes in the area
Purchase History
| Date | Buyer | Sale Price | Title Company |
|---|---|---|---|
| Byars Corey S | $133,000 | -- | |
| Sandridge Phillip | $47,500 | -- |
Source: Public Records
Mortgage History
| Date | Status | Borrower | Loan Amount |
|---|---|---|---|
| Open | Sandridge Phillip | $130,945 |
Source: Public Records
Tax History
| Year | Tax Paid | Tax Assessment Tax Assessment Total Assessment is a certain percentage of the fair market value that is determined by local assessors to be the total taxable value of land and additions on the property. | Land | Improvement |
|---|---|---|---|---|
| 2025 | $1,756 | $214,100 | $33,500 | $180,600 |
| 2024 | $1,383 | $179,600 | $28,500 | $151,100 |
| 2023 | $1,383 | $179,600 | $28,500 | $151,100 |
| 2022 | $1,221 | $135,700 | $25,000 | $110,700 |
| 2021 | $1,221 | $135,700 | $25,000 | $110,700 |
| 2020 | $990 | $110,000 | $25,000 | $85,000 |
| 2019 | $990 | $110,000 | $25,000 | $85,000 |
| 2018 | $815 | $90,600 | $25,000 | $65,600 |
| 2017 | $788 | $90,600 | $25,000 | $65,600 |
| 2016 | $690 | $86,200 | $25,000 | $61,200 |
| 2015 | $690 | $86,200 | $25,000 | $61,200 |
| 2014 | -- | $83,800 | $25,000 | $58,800 |
| 2013 | -- | $0 | $0 | $0 |
Source: Public Records
Map
Nearby Homes
- 1340 B St
- 1424 B St
- 1520 3rd St
- 317 Ivanhoe Ave
- 313 Ivanhoe Ave
- 309 Ivanhoe Ave
- 642 N Delphine Ave
- 1625 D St
- 1200 5th St
- 0 5th St
- 1200 5th St Unit 1200, 1204, 1208
- 1040 Reservoir St
- 644 N Bayard Ave
- 640 N Bayard Ave
- 600 N Bayard Ave
- 681 N Bayard Ave
- 628 N Augusta Ave
- 445 Kirby Ave
- TBD Calf Mountain Rd
- 513 N Bath Ave
Your Personal Tour Guide
Ask me questions while you tour the home.