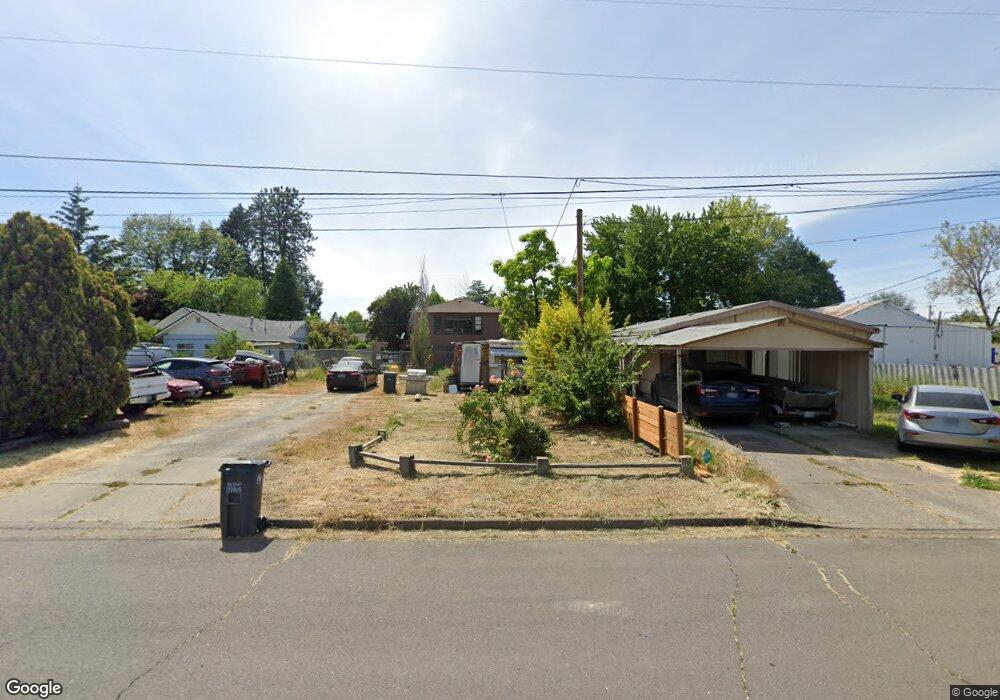
1330 Beekman Ave Medford, OR 97501
Southwest Medford NeighborhoodEstimated Value: $441,000 - $527,000
4
Beds
4
Baths
2,329
Sq Ft
$204/Sq Ft
Est. Value
About This Home
This home is located at 1330 Beekman Ave, Medford, OR 97501 and is currently estimated at $475,376, approximately $204 per square foot. 1330 Beekman Ave is a home located in Jackson County with nearby schools including Jefferson Elementary School, McLoughlin Middle School, and South Medford High School.
Ownership History
Date
Name
Owned For
Owner Type
Purchase Details
Closed on
Jun 25, 2020
Sold by
Taranto Ronald Joseph and Morgando Jeanne M
Bought by
Taranto Ronald J and Morgando Jeanne M
Current Estimated Value
Home Financials for this Owner
Home Financials are based on the most recent Mortgage that was taken out on this home.
Original Mortgage
$187,203
Outstanding Balance
$166,307
Interest Rate
3.2%
Mortgage Type
FHA
Estimated Equity
$309,069
Purchase Details
Closed on
Feb 23, 2018
Sold by
Taranto Ronald Joseph and Morgando Jeanne Marie
Bought by
Ronald J Taranto J and Ronald Jeanne M
Purchase Details
Closed on
Feb 20, 2018
Sold by
Taranto Ronald Joseph and Morgando Jeanne Marie
Bought by
Taranto Ronald J and Morgando Jeanne M
Purchase Details
Closed on
Jul 19, 1999
Sold by
Morgando Jeanne Marie
Bought by
Taranto Ronald Joseph
Home Financials for this Owner
Home Financials are based on the most recent Mortgage that was taken out on this home.
Original Mortgage
$141,500
Interest Rate
7.51%
Create a Home Valuation Report for This Property
The Home Valuation Report is an in-depth analysis detailing your home's value as well as a comparison with similar homes in the area
Home Values in the Area
Average Home Value in this Area
Purchase History
| Date | Buyer | Sale Price | Title Company |
|---|---|---|---|
| Taranto Ronald J | -- | Ticor Title Company Of Or | |
| Taranto Ronald Joseph | -- | Ticor Title | |
| Ronald J Taranto J | -- | None Listed On Document | |
| Taranto Ronald J | -- | None Available | |
| Taranto Ronald Joseph | -- | Amerititle |
Source: Public Records
Mortgage History
| Date | Status | Borrower | Loan Amount |
|---|---|---|---|
| Open | Taranto Ronald Joseph | $187,203 | |
| Previous Owner | Taranto Ronald Joseph | $141,500 |
Source: Public Records
Tax History Compared to Growth
Tax History
| Year | Tax Paid | Tax Assessment Tax Assessment Total Assessment is a certain percentage of the fair market value that is determined by local assessors to be the total taxable value of land and additions on the property. | Land | Improvement |
|---|---|---|---|---|
| 2025 | $4,363 | $332,430 | $189,770 | $142,660 |
| 2024 | $4,363 | $322,750 | $184,250 | $138,500 |
| 2023 | $4,230 | $313,350 | $178,880 | $134,470 |
| 2022 | $4,126 | $313,350 | $178,880 | $134,470 |
| 2021 | $4,020 | $304,230 | $173,680 | $130,550 |
| 2020 | $3,935 | $295,370 | $168,610 | $126,760 |
| 2019 | $3,842 | $278,420 | $158,920 | $119,500 |
| 2018 | $3,743 | $270,320 | $154,300 | $116,020 |
| 2017 | $3,676 | $270,320 | $154,300 | $116,020 |
| 2016 | $3,700 | $254,810 | $145,450 | $109,360 |
| 2015 | $3,556 | $254,810 | $145,450 | $109,360 |
| 2014 | $3,860 | $240,190 | $137,110 | $103,080 |
Source: Public Records
Map
Nearby Homes
- 0 Beekman Unit 1288
- 730 Aspen St
- 990 Janes Rd
- 854 W Stewart Ave Unit 1 & 2
- 1201 Kelly St
- 633 Aspen St
- 1012 Peachwood Ct
- 1029 Aspen St
- 820 Newtown St
- 1228 Douglas Ave
- 871 Marshall Ave
- 810 Grant Ave
- 1430 S Oakdale Ave
- 802 Grant Ave
- 788 Garfield St
- 1570 S Peach St Unit 115
- 801 Grant Ave
- 1010 Garfield St
- 719 Newtown St
- 877 Garfield St
- 1328 Beekman Ave
- 1335 S Peach St
- 1370 Beekman Ave
- 1355 S Peach St
- 1385 Beekman Ave
- 1341 Beekman Ave
- 1337 Beekman Ave
- 1300 Beekman Ave
- 1389 S Peach St
- 1329 Beekman Ave
- 1315 S Peach St
- 1389 Beekman Ave
- 1394 Beekman Ave
- 1393 S Peach St
- 1325 Beekman Ave
- 1346 S Peach St
- 1350 Peach St
- 1287 S Peach St
- 1322 Kyle St
- 1316 Kyle St