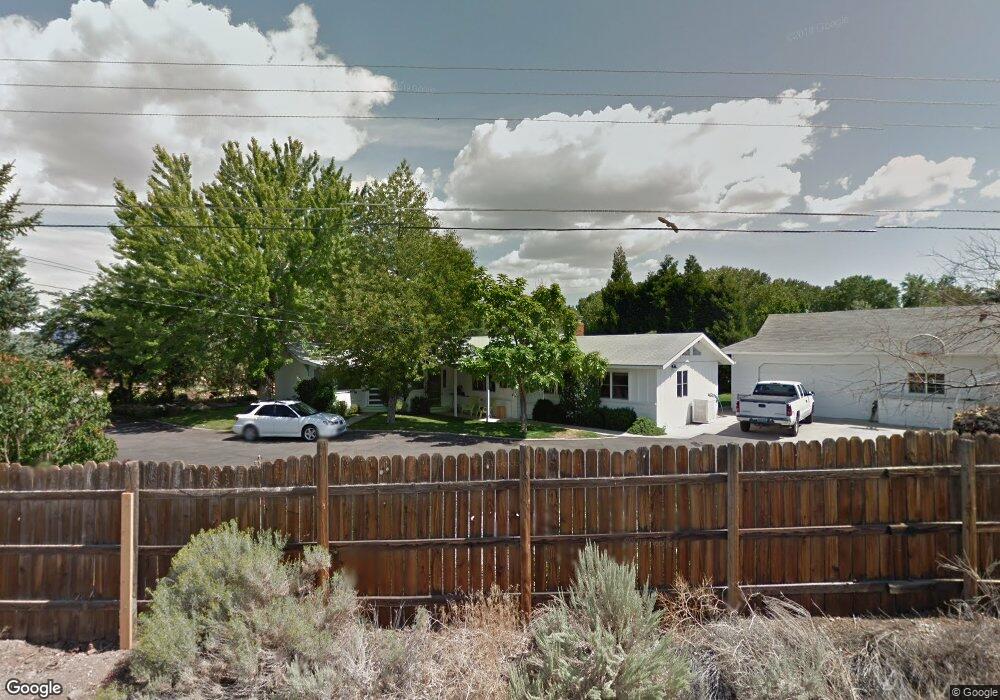
1330 Celese Cir Reno, NV 89511
Zolezzi Lane NeighborhoodEstimated Value: $685,000 - $964,000
3
Beds
2
Baths
1,476
Sq Ft
$559/Sq Ft
Est. Value
About This Home
This home is located at 1330 Celese Cir, Reno, NV 89511 and is currently estimated at $824,369, approximately $558 per square foot. 1330 Celese Cir is a home located in Washoe County with nearby schools including Elizabeth Lenz Elementary School, Marce Herz Middle School, and Galena High School.
Ownership History
Date
Name
Owned For
Owner Type
Purchase Details
Closed on
Jun 16, 2020
Sold by
Munro Alick R
Bought by
Munro Alick R and Alick R Munro Living Trust
Current Estimated Value
Purchase Details
Closed on
May 1, 2013
Sold by
Munro Susan J
Bought by
Munro Alick R
Purchase Details
Closed on
Apr 22, 2013
Sold by
Munro Alick R and Munro Susan J
Bought by
Munro Alick R and Munro Susan J
Purchase Details
Closed on
Feb 16, 2007
Sold by
Munro Alick and Munro Susan
Bought by
Munro Alick R and Munro Susan J
Purchase Details
Closed on
Feb 16, 2006
Sold by
Munro Alick Ross and Munro Susan Joy
Bought by
Munro Alick R and Munro Susan J
Create a Home Valuation Report for This Property
The Home Valuation Report is an in-depth analysis detailing your home's value as well as a comparison with similar homes in the area
Home Values in the Area
Average Home Value in this Area
Purchase History
| Date | Buyer | Sale Price | Title Company |
|---|---|---|---|
| Munro Alick R | -- | None Available | |
| Munro Alick R | -- | None Available | |
| Munro Alick R | -- | None Available | |
| Munro Alick R | -- | None Available | |
| Munro Alick R | -- | None Available |
Source: Public Records
Tax History Compared to Growth
Tax History
| Year | Tax Paid | Tax Assessment Tax Assessment Total Assessment is a certain percentage of the fair market value that is determined by local assessors to be the total taxable value of land and additions on the property. | Land | Improvement |
|---|---|---|---|---|
| 2025 | $2,254 | $135,829 | $94,763 | $41,067 |
| 2024 | $2,254 | $129,181 | $88,113 | $41,068 |
| 2023 | $2,189 | $120,978 | $83,125 | $37,853 |
| 2022 | $2,042 | $104,925 | $76,475 | $28,450 |
| 2021 | $1,982 | $91,581 | $63,574 | $28,007 |
| 2020 | $1,923 | $87,205 | $59,418 | $27,787 |
| 2019 | $1,867 | $81,929 | $55,125 | $26,804 |
| 2018 | $1,812 | $76,314 | $50,400 | $25,914 |
| 2017 | $1,759 | $69,530 | $44,100 | $25,430 |
| 2016 | $1,715 | $64,845 | $39,375 | $25,470 |
| 2015 | $428 | $57,715 | $31,500 | $26,215 |
| 2014 | $1,662 | $51,277 | $25,200 | $26,077 |
| 2013 | -- | $51,549 | $25,200 | $26,349 |
Source: Public Records
Map
Nearby Homes
- 10 Glenhaven Dr
- 13 Glenhaven Dr
- 17 Glenhaven Dr
- 1555 Boulder Field Way
- 935 Foothill Rd
- 13005 Broili Dr
- 19 Glenhaven Dr
- 21 Glenhaven Dr
- 24 Glenhaven Dr
- 27 Glenhaven Dr
- 12985 Broili Dr
- 11255 Boulder Glen Way
- 6090 Rock Creek Ct
- 1965 Palmira Dr
- 12015 Stoney Brook Dr
- 362 Wolf Run Ct
- 5018 W Albuquerque Rd
- 12565 Creek Crest Dr
- 11355 Maverick Ln
- 885 Creek View Dr
- 1400 Celese Ln
- 1320 Celese Cir
- 00 Foothill Rd
- 0 Celese Cir
- 1450 Foothill Rd
- 1395 Celese Cir
- 1415 Celese Ln
- 1420 Celese Ln
- 1325 Celese Cir
- 1425 Celese Ln
- 1315 Celese Cir
- 1390 Foothill Rd
- 1430 Foothill Rd
- 1385 Celese Cir
- 1426 Foothill Rd Unit P
- 1426 Foothill Rd
- 14025 Broili Dr
- 14045 Broili Dr
- 1435 Celese Ln
- 1550 Foothill Rd